
Wow.
I go away on vacation for one week and y’all drive the Cromford Index up to 200. What? You can’t wait for me to come back before you have a party?
Jeeeeeeeeze
Of course, Tina Tamboer of the Cromford Report has her weekly commentary about this occurrence. Here are the highlights. Then, let’s look at the consequences of this shift in the Cenpho and historic areas.
(I’ve added charts to illustrate what Tina is referring to.)
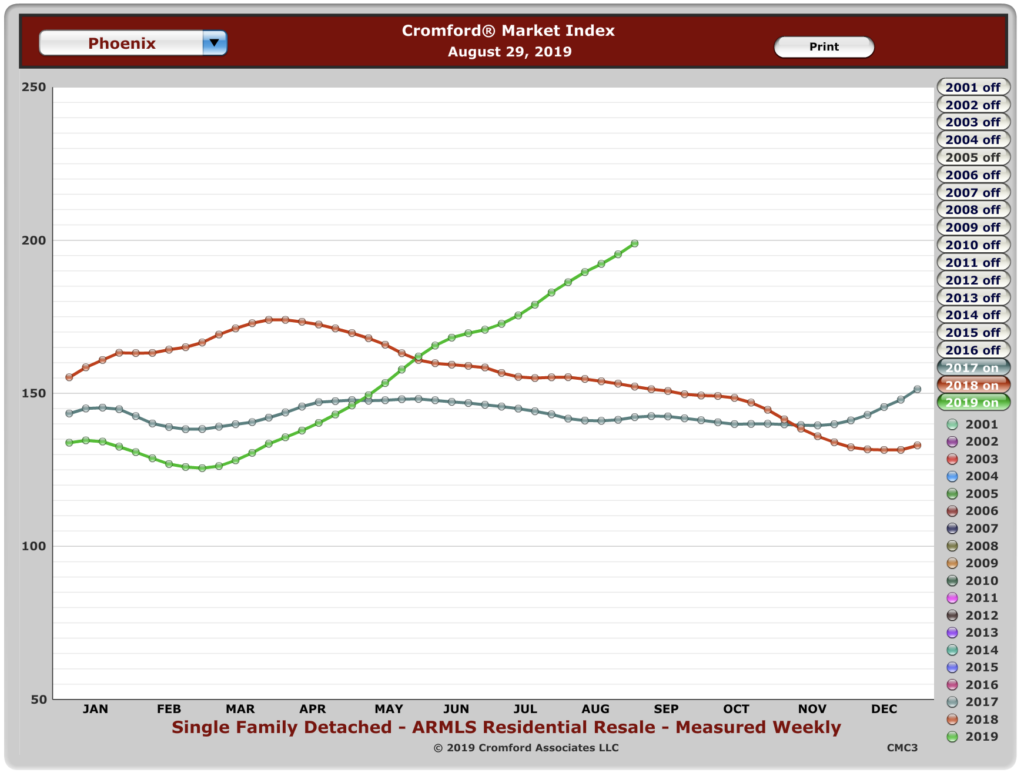
“With the Cromford® Market Index over 200 for the first time since 2005, the market is obviously hot and remarkably unbalanced in favor of sellers. Demand is some 8% above normal, which is strong but not too unusual. What is unusual is that supply is 43% below normal. We have had supply below normal ever since May 2011. but the weak flow of new listings has exacerbated the situation.
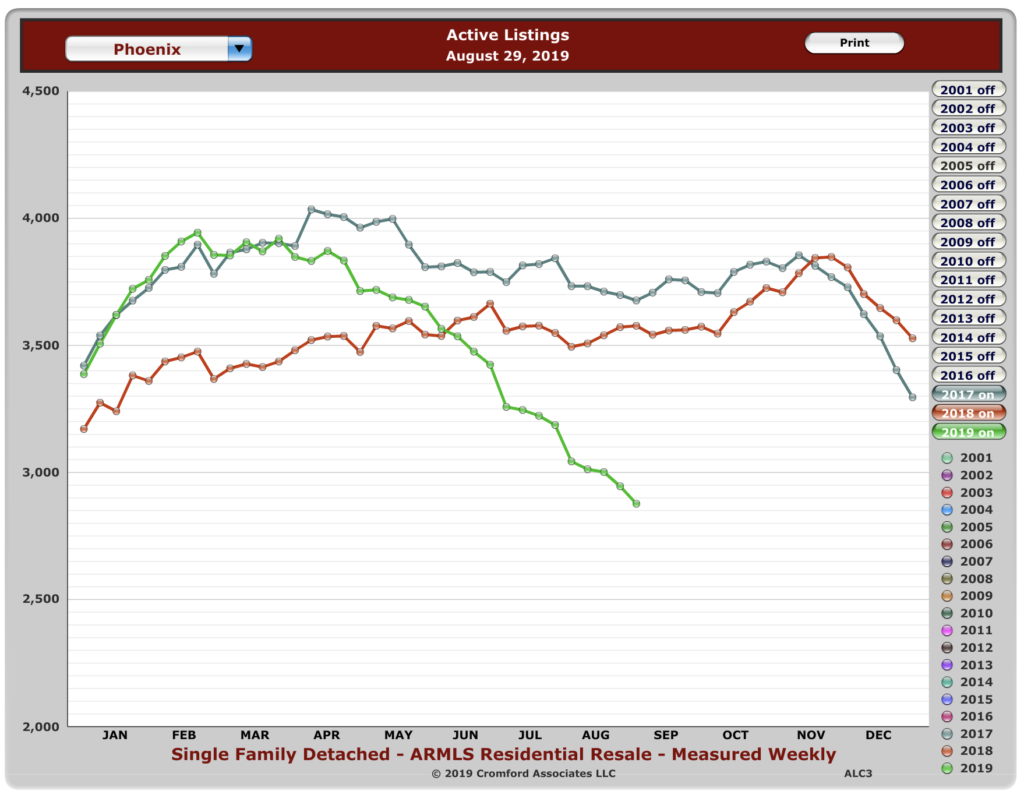
Active listings widened the gap compared to last year but declined much less in August than they did in July. Normally active listings grow each year between August 1 and September 1, so even though the decline was gentle it is not good news for buyers.
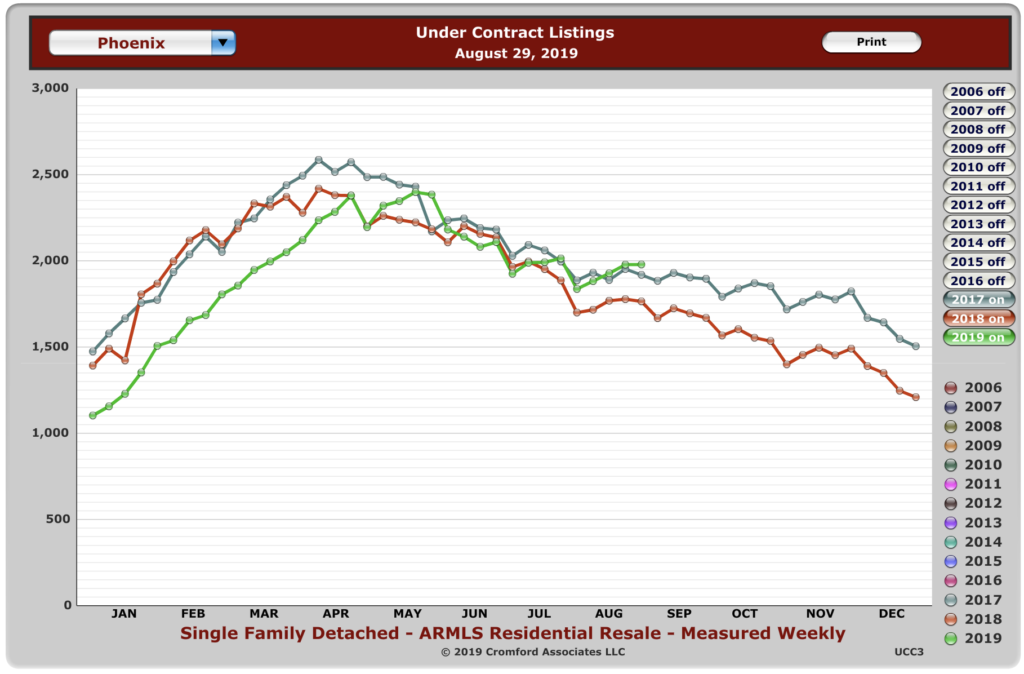
Listings under contract gained more momentum when compared with 2018 but fell sequentially (as is normal every year). Closed listings beat last year by 6.7%. August had the maximum 23 working days in both 2018 and 2019 so this comparison needs no adjustment – we are doing about 7% more business through the MLS than this time last year, measured in units. Of course the average price is up over the last 12 months so dollar volume is up by almost 12%.
Demand usually subsides between July and January every year so unless there a brand new trend develops we should see new listings maintain enough momentum to keep active listing counts from falling much further, if at all. However when demand grows again again in February we can expect a mad scramble. We will probably look back on 3Q 2019 and wonder how prices managed to stay so low. Based on existing data, the Cromford® Report expects a strong upward trend in closed pricing between October 2019 and June 2020.”
So, how are things in the Cenpho/historic areas? Let’s look at some of the same measures for the areas where most historic properties are: 85003, 85004, 85006, 85007, 85012, 85013, 85014, 85015.
(I do love these pretty charts. So many colors!)
First, the difference from just last year is striking, and mirrors the valley-wide chart that Tina spoke about, above. Now, as Tina said, hopefully this imbalance will level out as the year progresses. However, if you have a home you are thinking of listing, now is the time to do it!
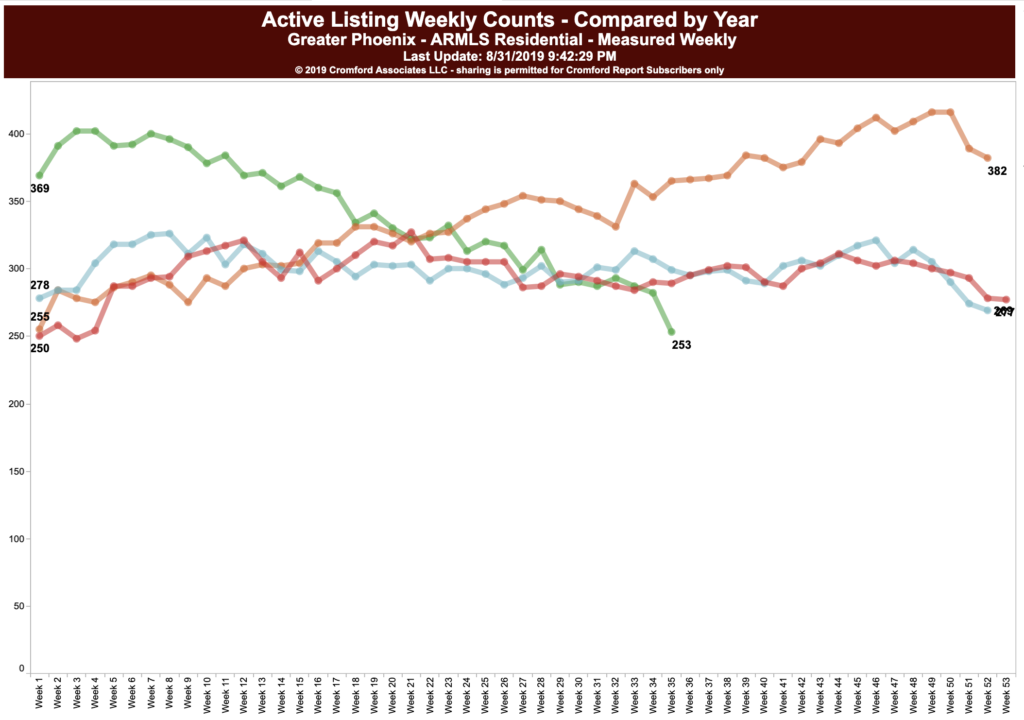
This change represents a 30.7% difference from this time last year. And, you can feel it. We have listings on the market now that are getting tons of showings. This time last year, we were struggling to get showings, even with a beautiful home in Coronado at about $350k. Our clients decided to rent it for a year and try again. You will see that listing on this website and in our newsletter. It was a very smart move on their part.

Looking at the year-over-year change in “under contract”, you see the same thing in our area, as Tina spoke about valley-wide. This may not seem surprising, but there are many times that the CenPho area defies trends of the whole valley.
So, this tells us that, if you are listed, you are going to sell and you will sell quickly — at least until some of the buyers go away near the end of the year when the holidays come around.
If you are a buyer, I feel for you. If you are a buyer who was saying that you were going to wait for the market to drop when we were predicting to you that it won’t, well, I still feel for you.
None of us has a crystal ball. But I think the following will remain true: there is a shortage of available housing in Cenpho because the land is almost entirely built out and developers prefer apartments over condos (which is a shame).
So, while we are certainly heading toward an over-all economic correction in the US and AZ, the supply of homes will not shift much. Even if demand decreases due to larger economic factors, don’t expect prices to drop too far.
I predict one scenario in which prices could drop, but it is uncharted territory, so we just don’t know. You may have heard me talk about it: the Air BnB bubble.
There are so many properties on the market that were scooped up for AirBnB, that it deprived buyers of real homes. Well, if the over-all economy drops “hotel stays” drop, many of those homes may come on the market, thus increasing supply at a time when demand is weak.
I’m gonna bookmark this prediction to see how correct it is.
But, for now, if you need a house, buy a house. I don’t see prices dropping any time soon.


