
This little snapshot of the market is really useful, and the folks at the Cromford Report put it out every month.
You can see that the active listings are down by 5.6%, valley-wide. At the same time the listings under contract are up by 7.4% and the number of closed sales is up by about 1%.
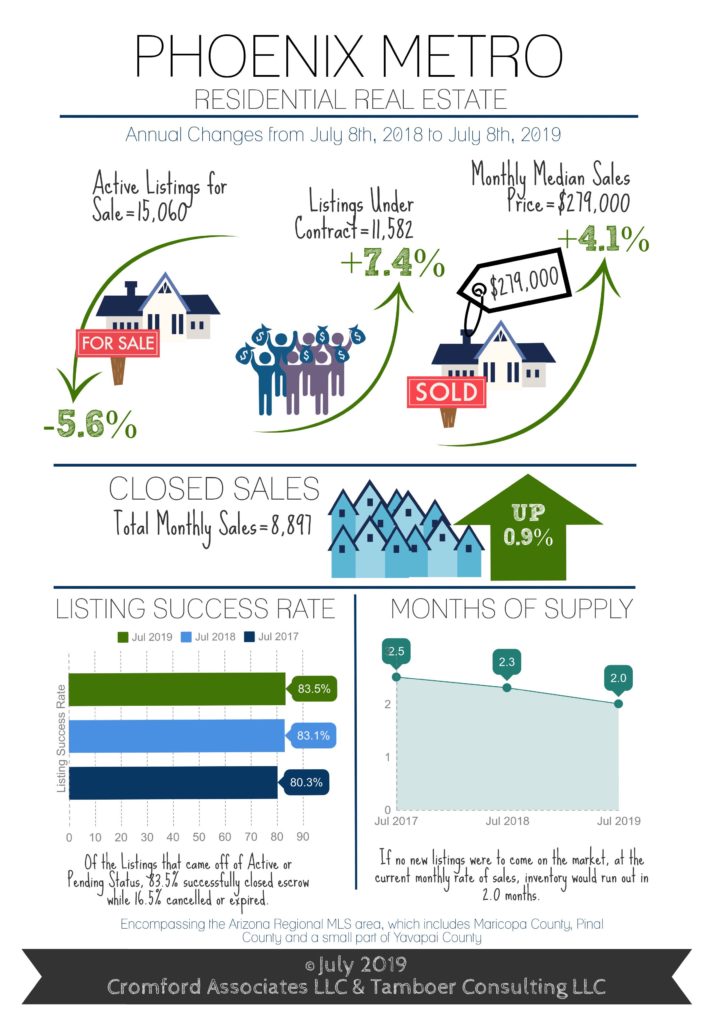
What does that mean?
It means we are burning through the available inventory. It also means that there continues to be an upward pressure on prices. That is why you see the Months of Supply graph going down from 2.5 months to 2 months.
The way to look at this particular snapshot of supply is to ask, “if no other houses came on the market and people continue to purchase at current rates, how many months would it take to totally exhaust the inventory?”
It’s a fanciful notion, to be sure, because people will always list homes. But it gives us an idea of how fast things are selling.
The listing success rate is about the same this July as it was last July and the July before that. So, the strong seller’s market is steady over three years.
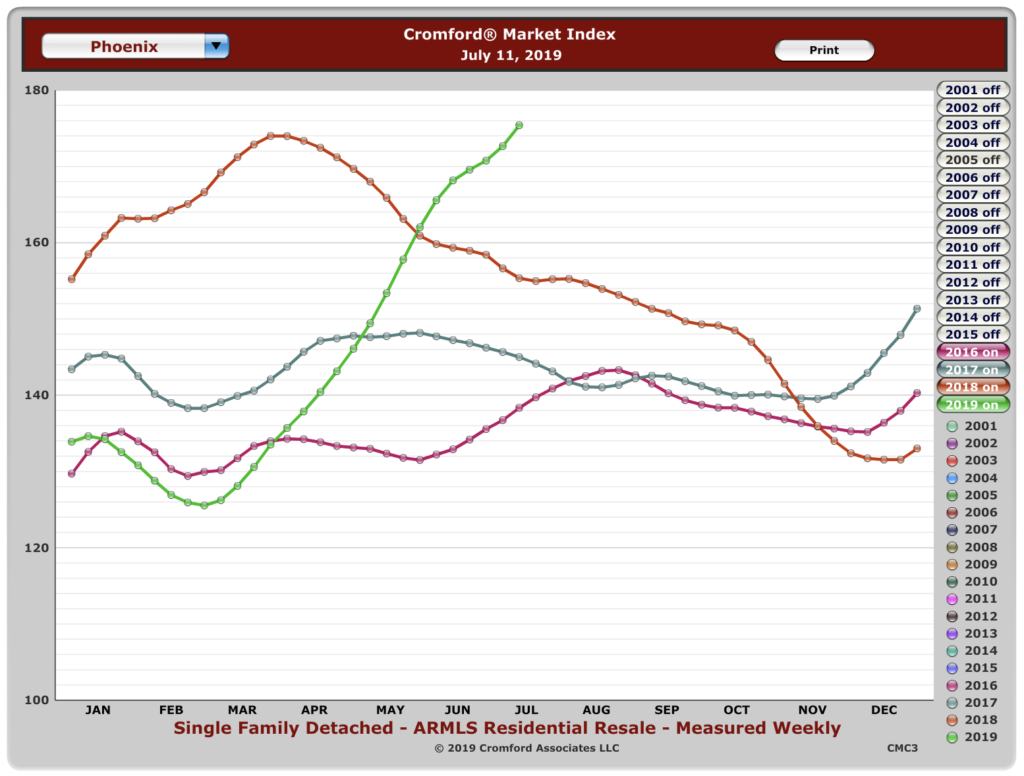
If we turn to the Cromford Index, you can see that the seller’s advantage that had weakened at the end of last year is rocketing upward right now.
The big question will be what happens when the summer draws to and end and we see what is typically the second-busiest market time every year, between September and late November?
To be sure, this summer has been pretty busy. Will buyers hold off, waiting for prices to cool, or will they calculate that prices will continue upward?
I continue to predict that, if/when a market correction comes, it will be less dramatic in CenPho, where we can’t seem to find space for new construction. Inventory will continue to be tight.
If you need help building a strategy to sell or buy a home, call us at 602-456-9388.


