
The July Market Update sees a massive shift from previous months, according to our friends at the Cromford Report.
Here are the basics:
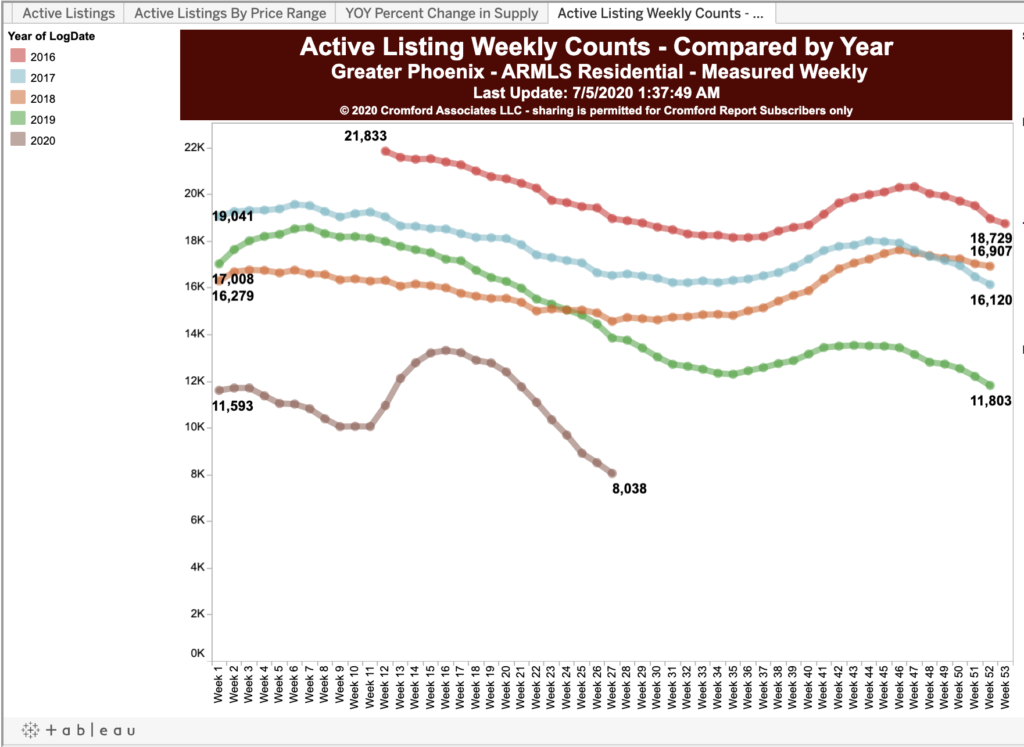
- Active Listings (excluding UCB & CCBS): 8,788 versus 15,422 last year – down 43.2% – and down 26.5% from 11,917 last month
- Active Listings (including UCB & CCBS): 14,279 versus 20,030 last year – down 28.7% – and down 16.8% compared with 17,171 last month
- Pending Listings: 7,933 versus 6,642 last year – up 19.4% – and up 9.8% from 7,224 last month
- Under Contract Listings (including Pending, CCBS & UCB): 13,424 versus 11,230 last year – up 19.5% – and up 7.6% from 12,478 last month
- Monthly Sales: 9,702 versus 9,476 last year – up 2.4% – and up 37.8% from 7,040 last month
- Monthly Average Sales Price per Sq. Ft.: $182.71 versus $172.17 last year – up 5.8% – and up 1.6% from $179.82 last month
- Monthly Median Sales Price: $305,000 versus $279,000 last year – up 9.3% – and up 4.1% from $293,000 last month
“Supply is crashing – down 26.5% (excluding UCB and CCBS listings) in a single month – and this is the most important factor in the state of the market. Without an improvement in supply, life will become ever more difficult for buyers while sellers will be dealing with many competing offers even if demand were to decline substantially. For sellers this is a nice problem to have, but for buyers the level of competition from other buyers presents a massive obstacle to them achieving their goals. This extends to the iBuyers who have seen their acquisition numbers collapse since the first quarter. Their market share has dropped substantially as a result.
Demand has recovered from the pandemic-induced slump of April and May and is now benefitting from the catch-up effect, replacing the sales that were deferred during the second quarter. At price points below $600,000, the market is constrained by the shortage of homes for sale.
Price measurements took a hit during April and May due to a few panic sales and the small number of high-end homes closed, but they are recovering at a fast pace now. The median sales price is juiced up by the lack of homes selling under $275,000 and the monthly median rose over 4% during the single month of June. We expect this to continue as a strong upward trend while homes under $400,000 remain in very short supply. The average $/SF is a more stable measurement but this rose 1.8% during June, as the top end of the market started to function properly again. Based on the number of luxury homes that are under contract, the average $/SF for July is expected to be substantially higher this time next month. Both list price and under contract price $/SF are now in an upward trend.
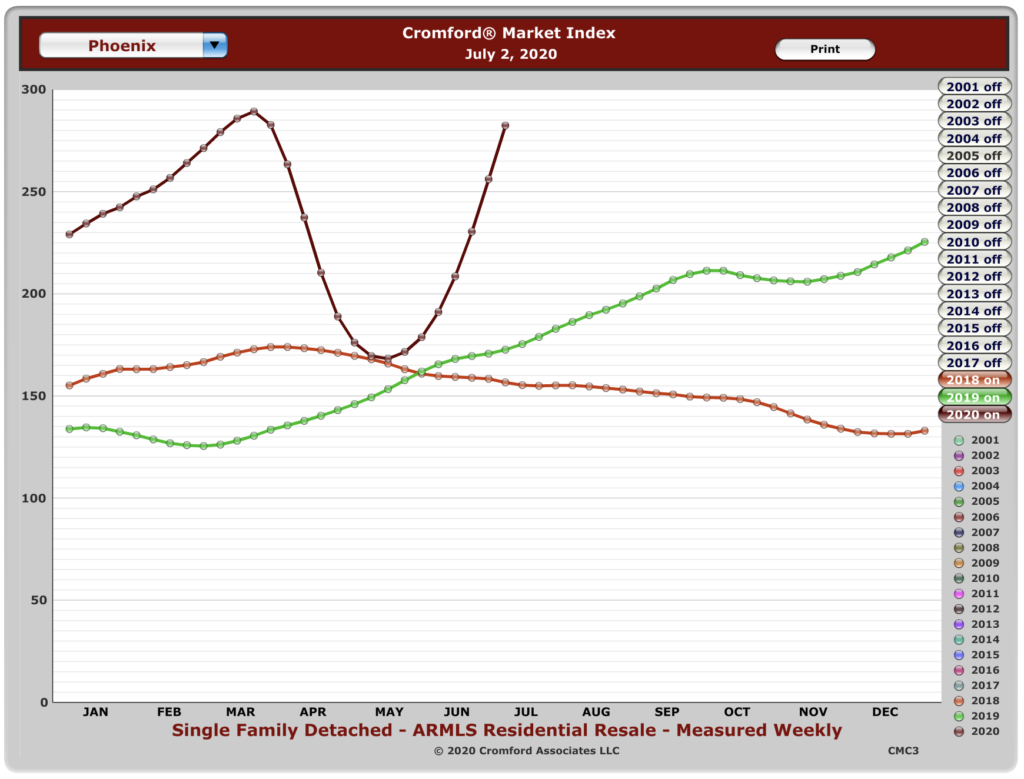
The Cromford® Supply Index has dropped from 52.9 to 44.1 over the last month. The normal reading is 100 and 41.3 represents the record low touched in April 2005. It is looking likely that we will crash through that record low during July. The Cromford® Demand Index has recovered from 83.7 to 102.5, a remarkable surge, taking us from well below normal to slightly stronger than normal (100). At the moment both the CSI and CDI numbers are diverging so the Cromford® Market Index can only go higher still. It stood at 232.7 on July 1 and the record high is 313, set in the spring of 2005. This is the first time that record has looked in danger since 2005.”
So, given all of that, what does it mean for you? Well, if you are selling a home, and if you are priced reasonably, expect multiple offers –especially if your home is listed below about $400,000.
Homes that require jumbo loans may see fewer offers as a result of a slump in the jumbo lending market. That slump is caused by new requirements of 20% down for jumbos, and we don’t know how long that will last.
We reported last month that active listings were dropping in number, but I’m not sure even Michael Orr at Cromford predicted this. So, it leaves us to wonder what the rest of the summer will be like.
If you need help thinking through your next move, contact us at 602-456-9388.


