
“How are we fairing in terms of supply March vs. March?”, you ask?
“As in March of 2022 vs March of 2021?”
I’m happy to tell you! This information tells you a lot about where things are moving, as investment funds continue to gobble up about 1 in every 4 home sales.
Well, here’s what the Cromford Report has to say about it.
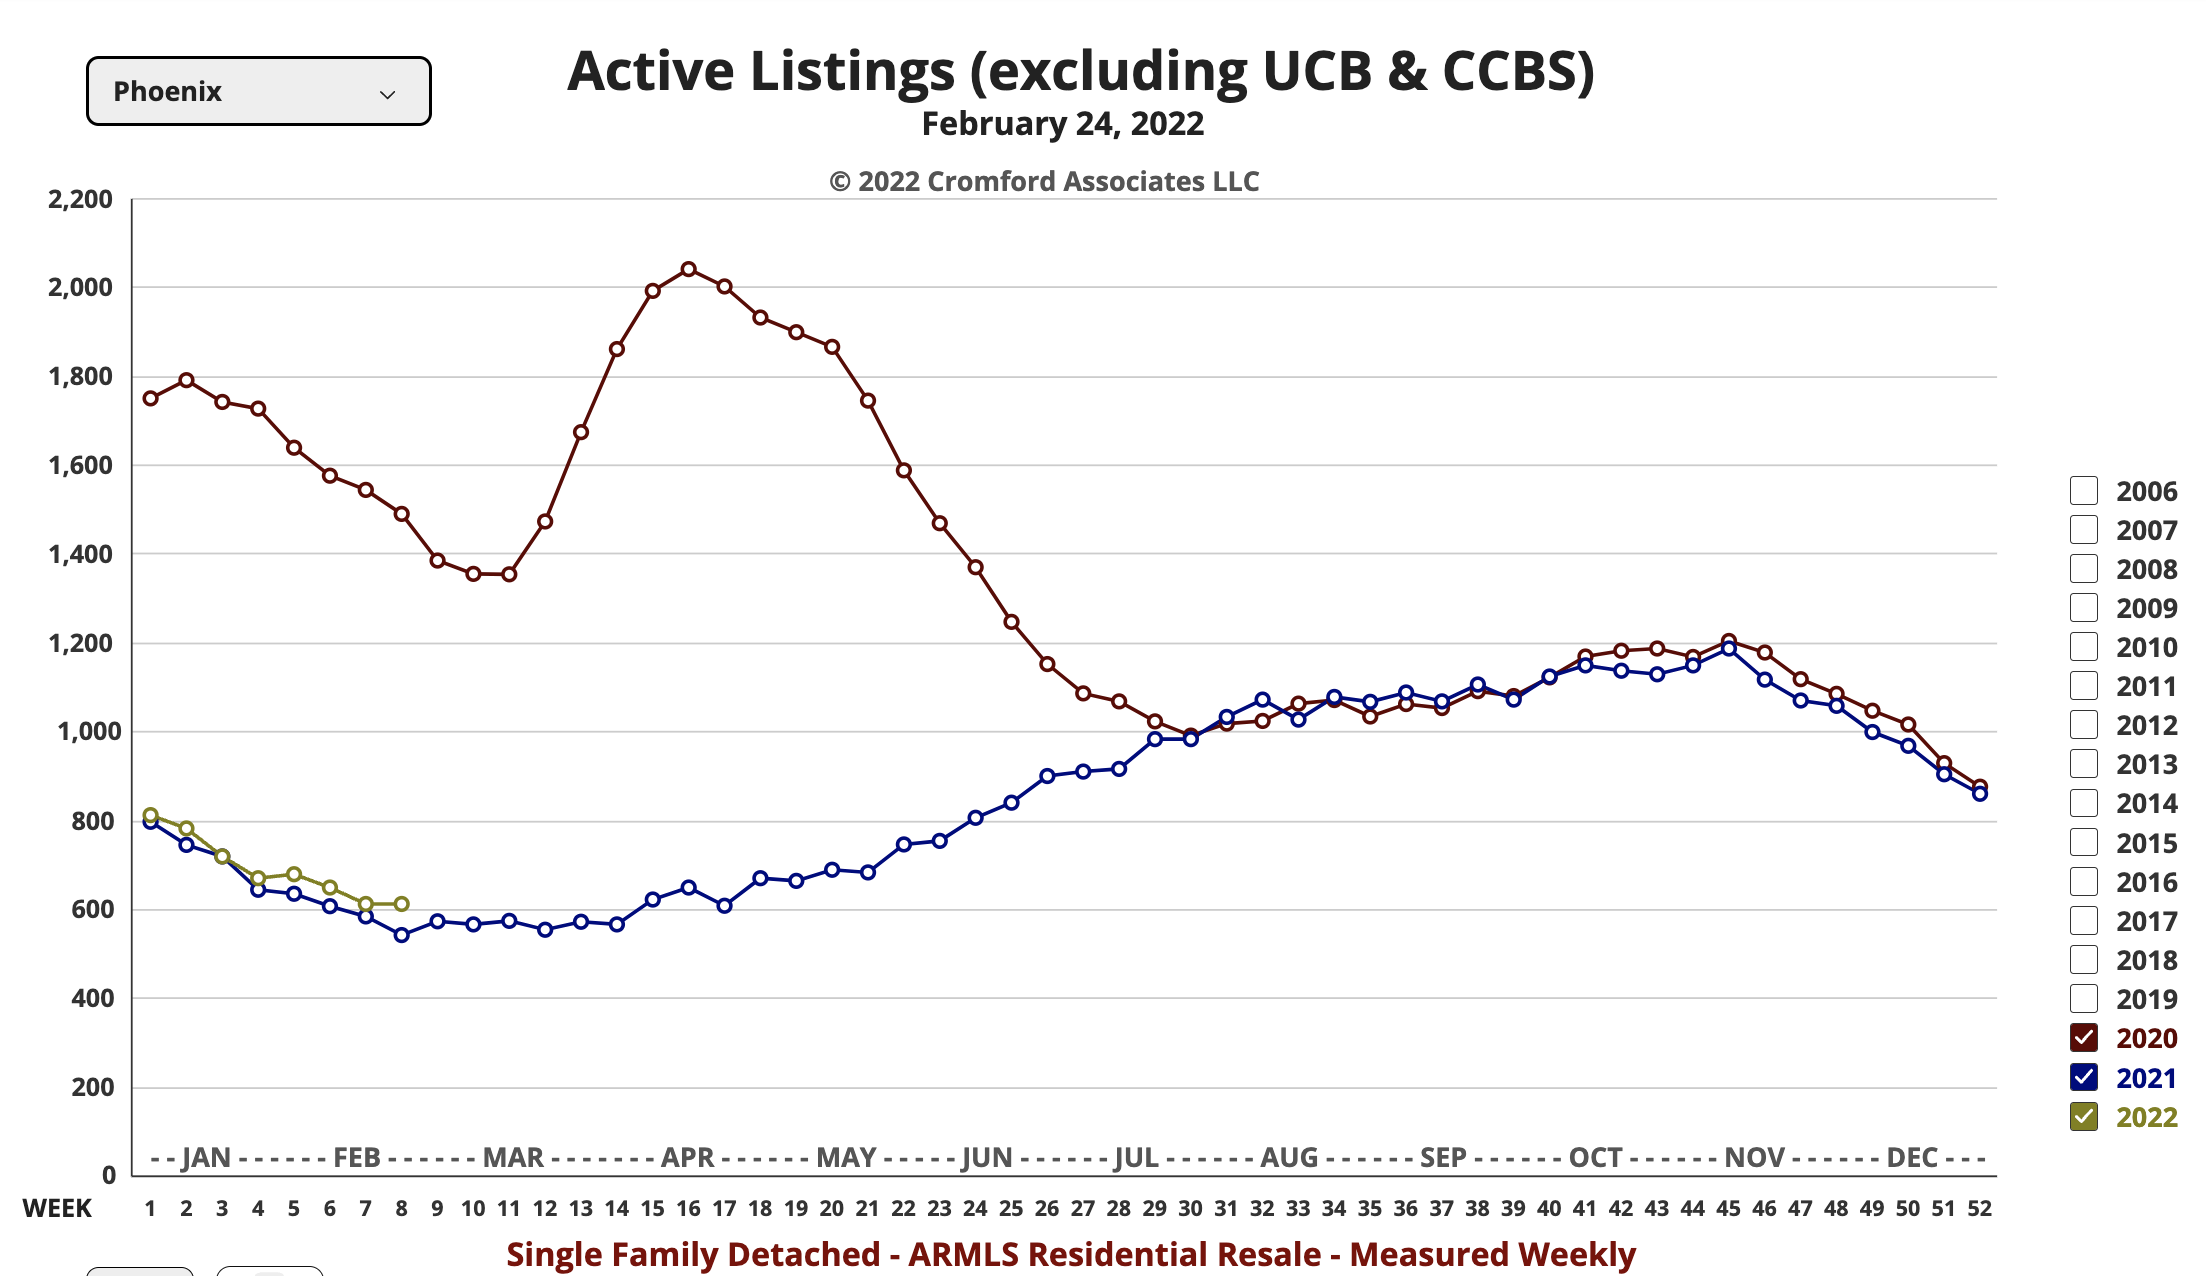
- “Active Listings (excluding UCB & CCBS): 4,588 versus 4,491 last year – up 2.2% – but down 5.9% from 4,876 last month
- Active Listings (including UCB & CCBS): 8,305 versus 9,094 last year – down 8.7% – and down 0.9% compared with 8,380 last month
- Pending Listings: 8,333 versus 8,027 last year – up 3.8% – and up 6.9% from 7,798 last month
- Under Contract Listings (including Pending, CCBS & UCB): 12,050 versus 12,630 last year – down 4.6% – but up 6.6% from 11,302 last month
- Monthly Sales: 8,000 versus 8,035 last year – down 0.4% – but up 12.7% from 7,096 last month
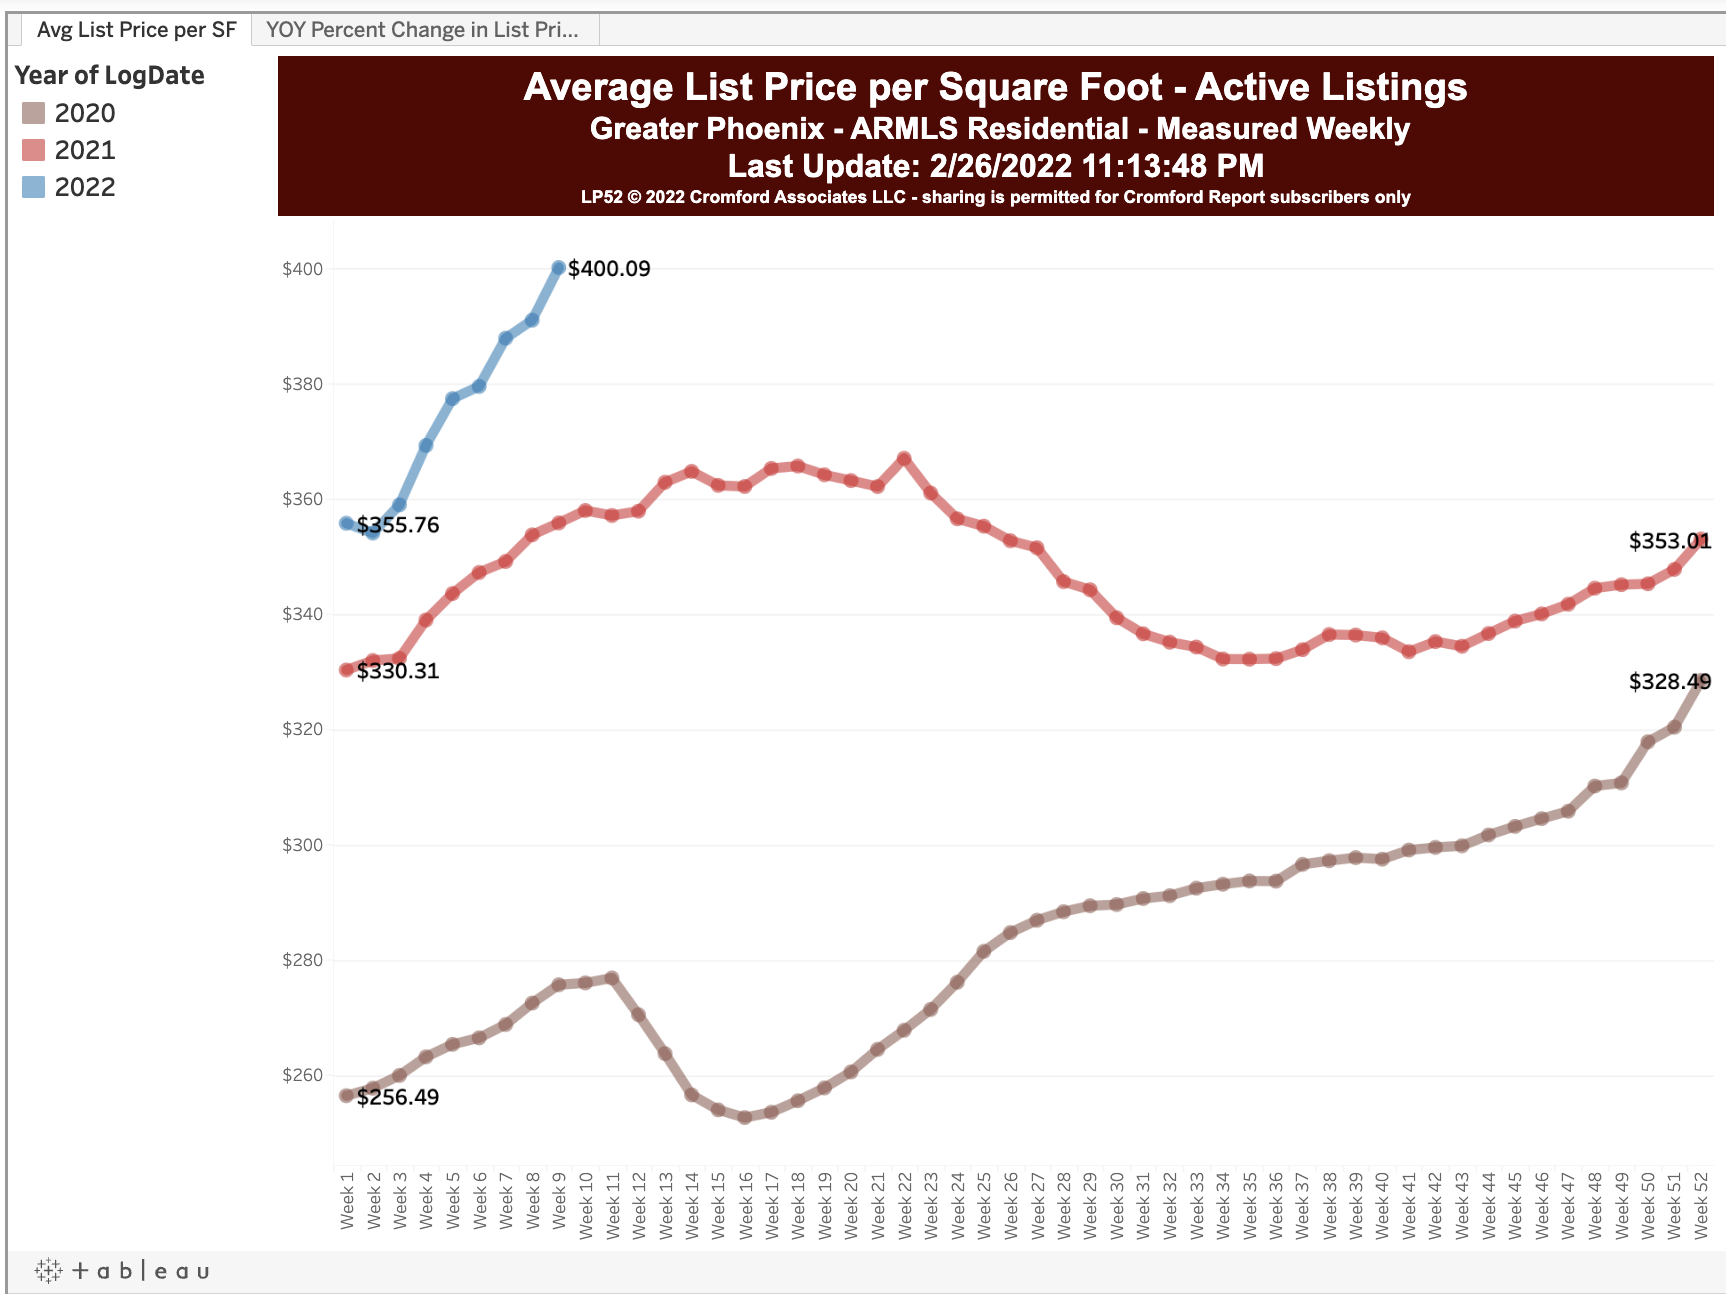
- Monthly Average Sales Price per Sq. Ft.: $284.55 versus $231.11 last year – up 23.1% – and up 3.6% from $274.70 last month
- Monthly Median Sales Price: $445,000 versus $349,000 last year – up 27.5% – and up 2.7% from $433,500 last month”
In English, please?
“The downward trend in supply that started in late October continued throughout February, but slowed down. We have slightly more inventory than we had this time last year, as long as we exclude UCB and CCBS listings. We have fewer active listings in total, but UCB counts have fallen by almost 20% compared to a year ago.
Demand is slightly below last year but given the sharp increase in interest rates, it is holding up pretty well. The market is cooler than a year ago, but not by much. The contract ratio stands at 263, down from 281 this time last year, but still abnormally high. In a normal market, this would be somewhere between 30 and 60.
Prices are rising at colossal speed. The average $/SF has risen 6.2% in the first 2 months of the year and are likely to continue rising until May at least. The median sales price is up from $425,000 to $445,000 in 2 months and looks likely to break $470,000 by the end of the second quarter. The third quarter is always a slower period and we may get some respite from the rising prices between June and September.
There are plenty of observers suggesting the market is due for a downturn, but the market is not giving off any data to support that opinion. Supply remains extremely low with no sign of significant new supply of homes to buy. Demand is down a little but seems to be extremely resilient and although it is lower than last year, it remains very strong by historic standards. A change may happen, and you know we will report it if it is there to be seen. Right now there is no change to report.”
So, if you are looking to buy, be prepared for prices to continue to push upward.
If you are looking to sell, get it listed before the summer heat comes on.
Call us at 602-456-9388 to build a strategy for success.


