
We keep hearing news of a market in distress, albeit an odd kind of distress where high interest rates are pushing historically-high prices slowly down.
But that’s not the case, according to our friends at the Cromford Report:
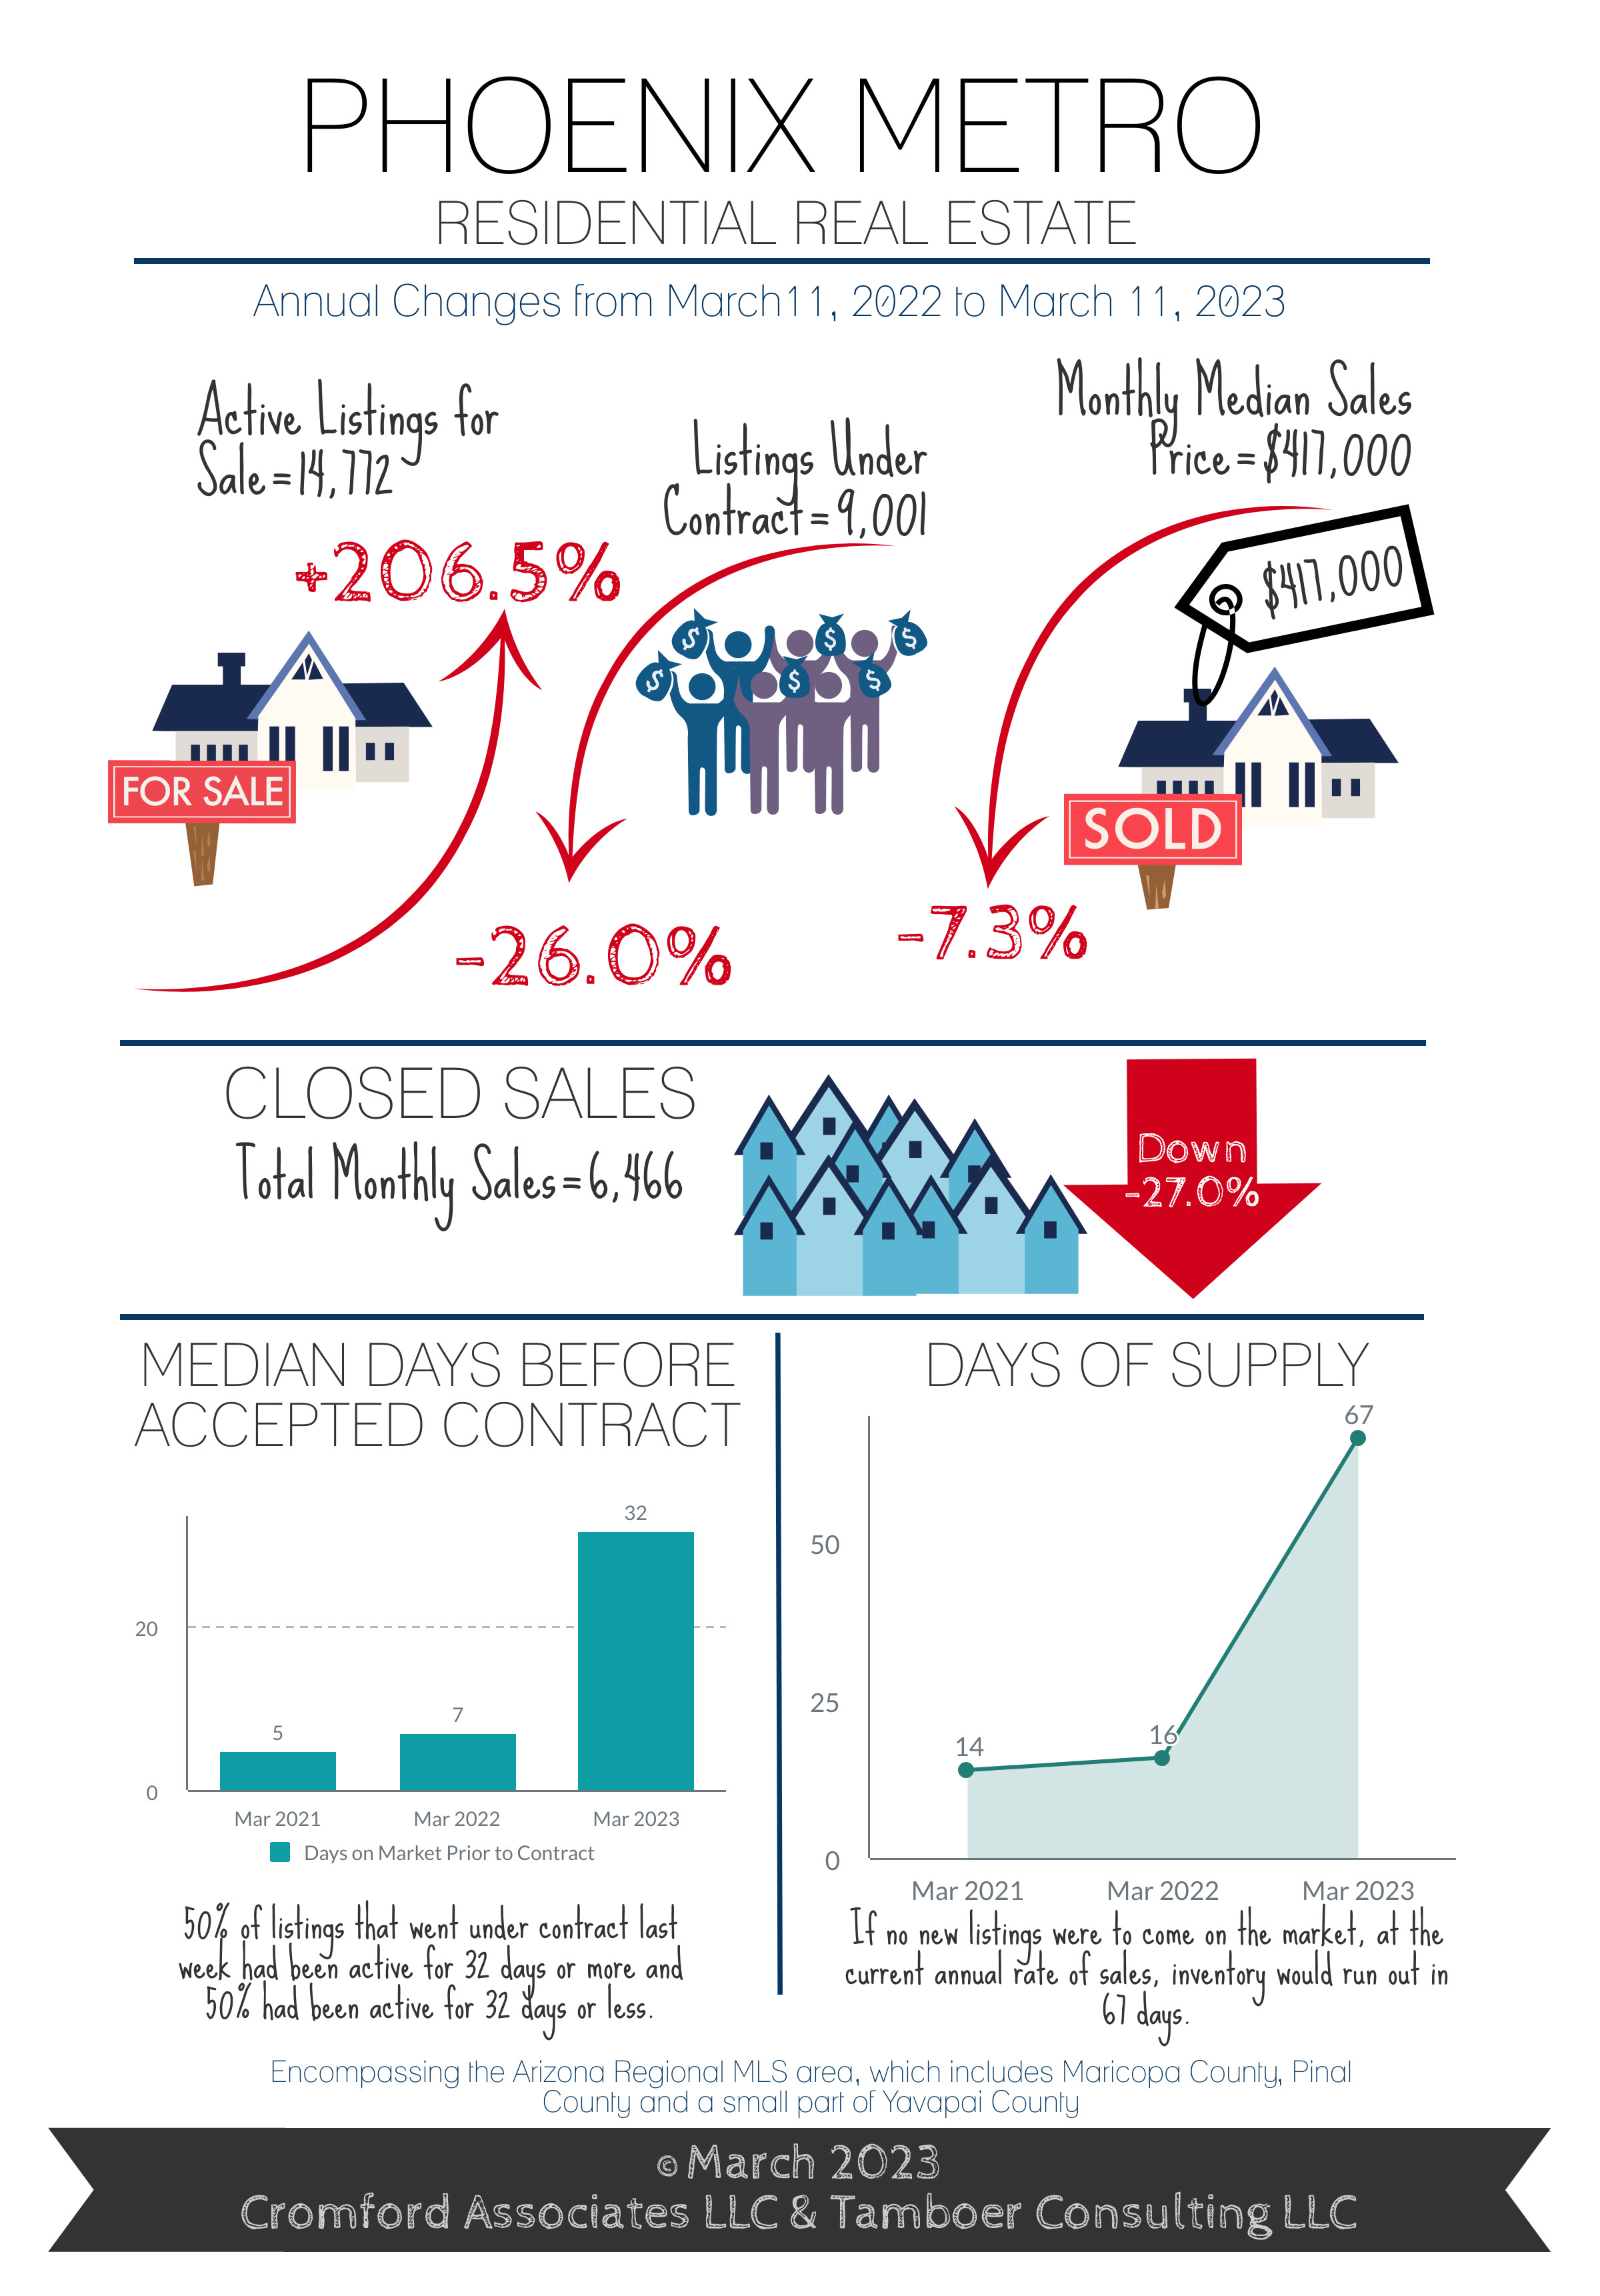
“After 200% Increase, Supply Still Nearly 40% Below Normal
Sale Prices Up 3.5% Since December (Even though they are down since last March.)
For Buyers:
Rates defied industry predictions once again and rose over a point from 5.99% to 7.1% between February 2nd and March 2nd. For the past 4 weeks, rates have hovered in the upper 6% range, figuratively “pinching the hose” on demand during the popular Spring season for buyers.
At 9,001, contracts are at their 4th lowest count since 2005, the lowest counts were in 2006-2008 and normal range is 11,000-13,000. Buyers are not the only ones holding back due to higher mortgage rates, sellers are too. New listings added to the Arizona Regional MLS are the lowest ever recorded going back at least 23 years.
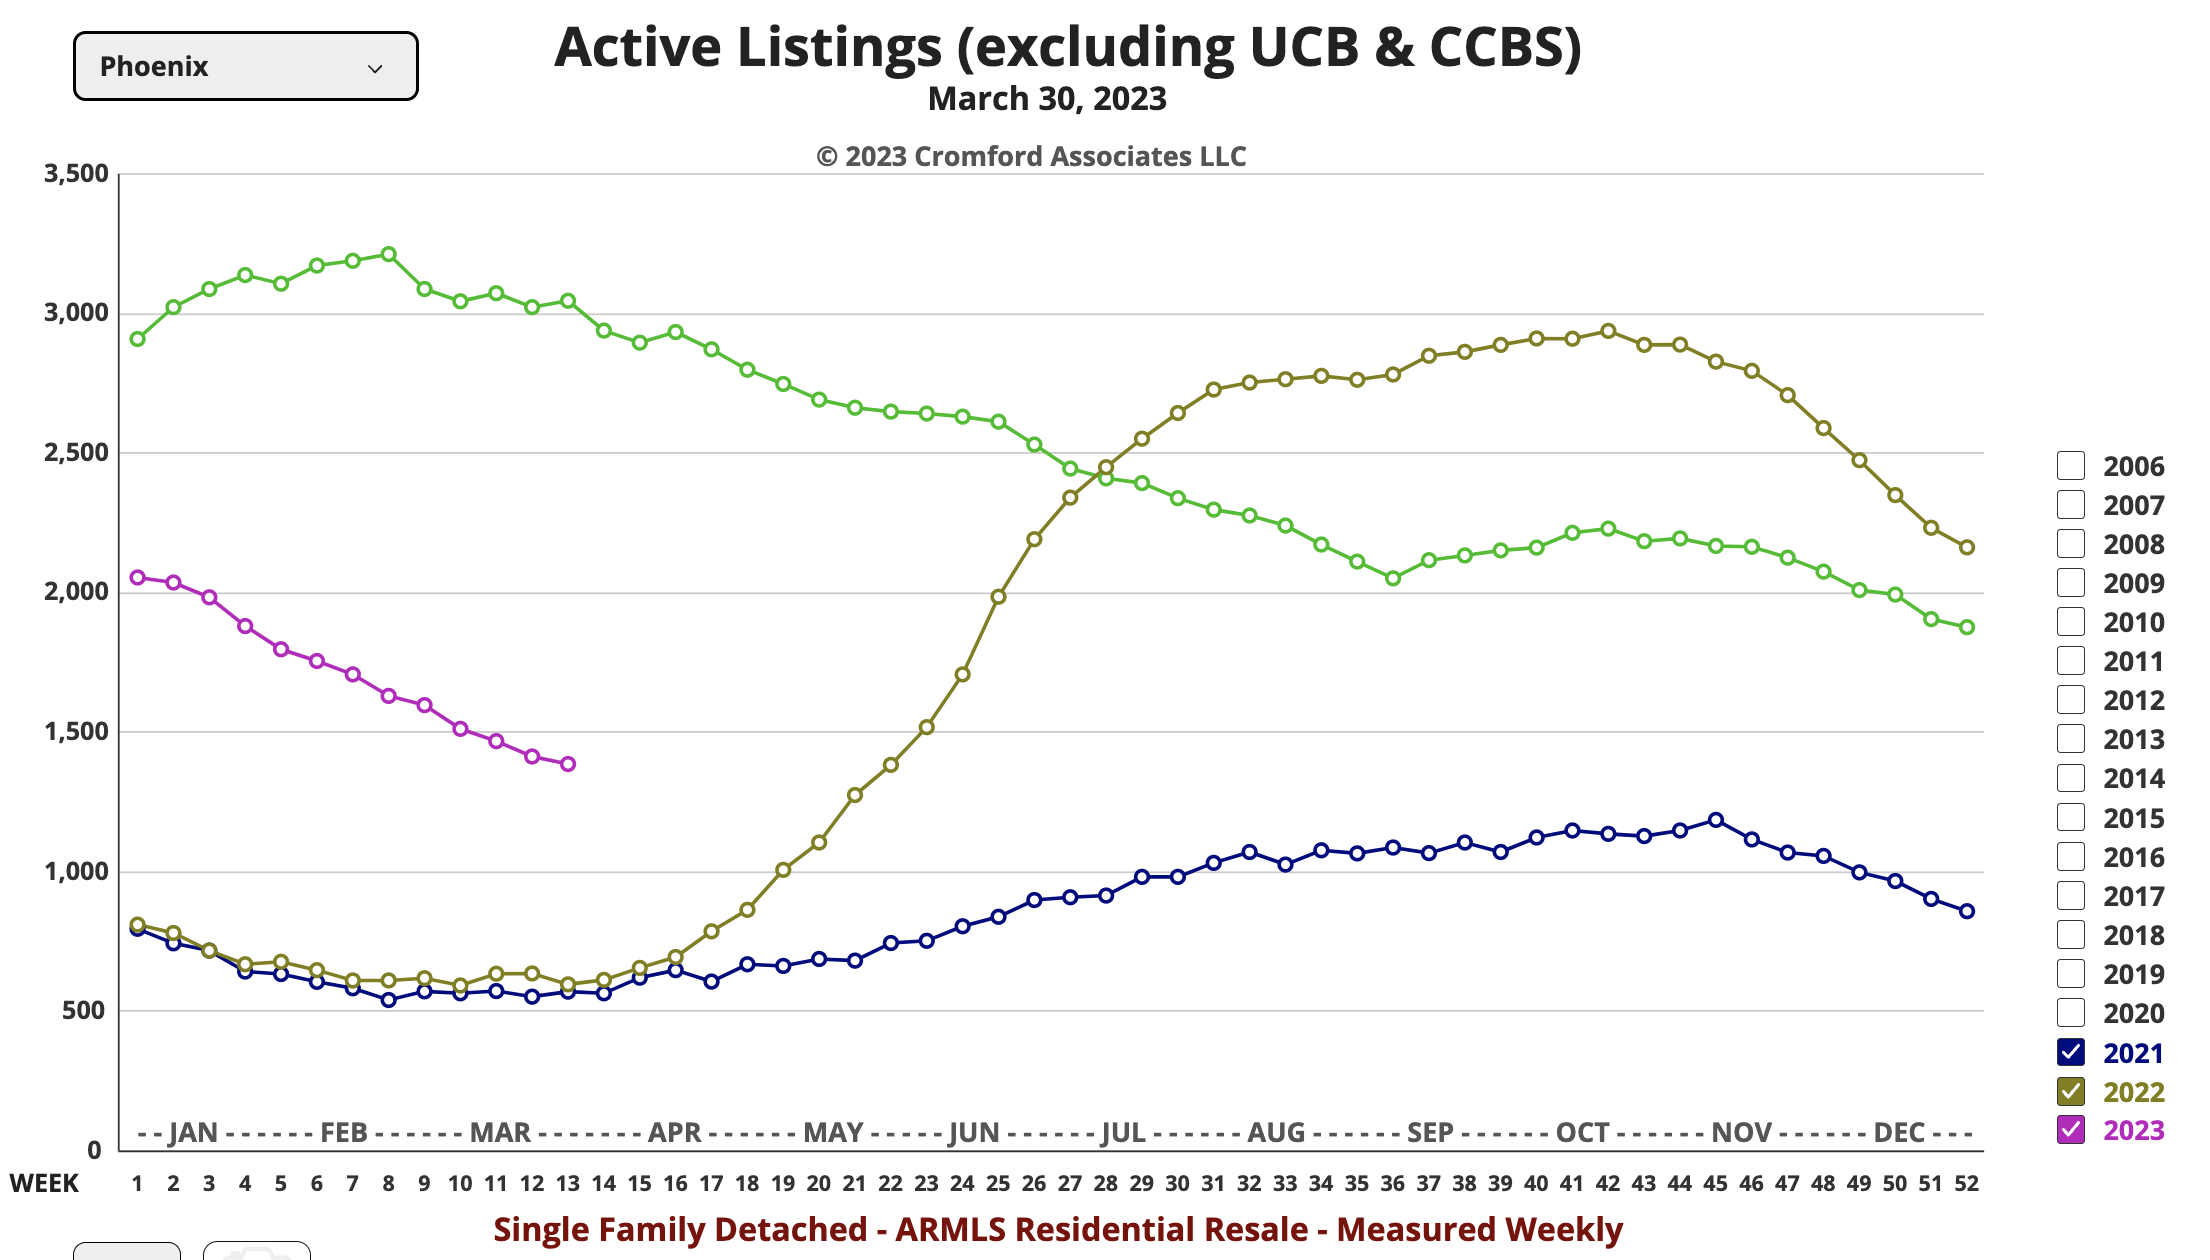
This may be shocking to some as there has been a 200% increase in supply year-over-year, but last year at this time supply was merely 4,820 active listings. The reality is that ARMLS active supply spiked over 300% last year between March and October, peaking around 20,000 listings. But since then it has declined 27% to 14,772, which is the 4th lowest supply count since 2005 for this time of year. Typically, active listings should be between 20,000-24,000 to be considered normal. In a nutshell, while higher rates have stunted demand for now, they are not expected to stay high forever. If and when they come down, expect demand to increase again.
For Sellers:
Low-level demand combined with even lower-level supply equals a seller’s market for Greater Phoenix. Not a crazy one like the last 2 years, but since coming out of a buyer’s market last December sale price measures have stopped dropping and have risen a modest 3.5% so far.
Sellers continued to pay for buyers’ closing costs on 48% of MLS closings in March, with half paying $9,000 or more. Fewer new listings hitting the market has meant less pressure on sellers to reduce their list price. As a result, weekly price reductions are actually falling instead of rising as they typically would at this time of year. Only 13-14% of inventory issued a price reduction last week compared to 25% of inventory last October.
The average negotiation is 97.4% of the last list price this month, an improvement from 96.5% in January and in line with the pre-pandemic market of 2019. Current median days on market prior to an accepted contract is 32 days. Most seasonally-adjusted housing measures are reflective of a weak seller’s market similar to 2015 where properties appreciated an average of 4.6% annually.
The majority of cities in Greater Phoenix are now in seller’s markets. Only 5 cities remain in buyer’s markets at this stage. They are Queen Creek, Maricopa, Buckeye, Casa Grande, and Sun City West. The outskirts of town tend to be the first to enter buyer’s markets and the last to come out. While these cities are lagging the rest of the valley, their measures have all improved 8-14% over the past month.
Commentary written by Tina Tamboer, Senior Housing Analyst with The Cromford Report
©2023 Cromford Associates LLC and Tamboer Consulting LLC
Trimmed by Get Your PHX for brevity.


