Anecdotally, I feel like I’m seeing more listings coming on as I’m writing this monthly market update, and as I was preparing a tour yesterday. In addition, people are speculating that more will come on as more people get vaccines. However the look-back over the last month from the Cromford Report indicates just the opposite.
Let’s check in with the analysts there for some highlights from their monthly market update, which came out on March 1. I encourage you to read this whole piece, as it covers a whole slew of market-wide issues and myths.
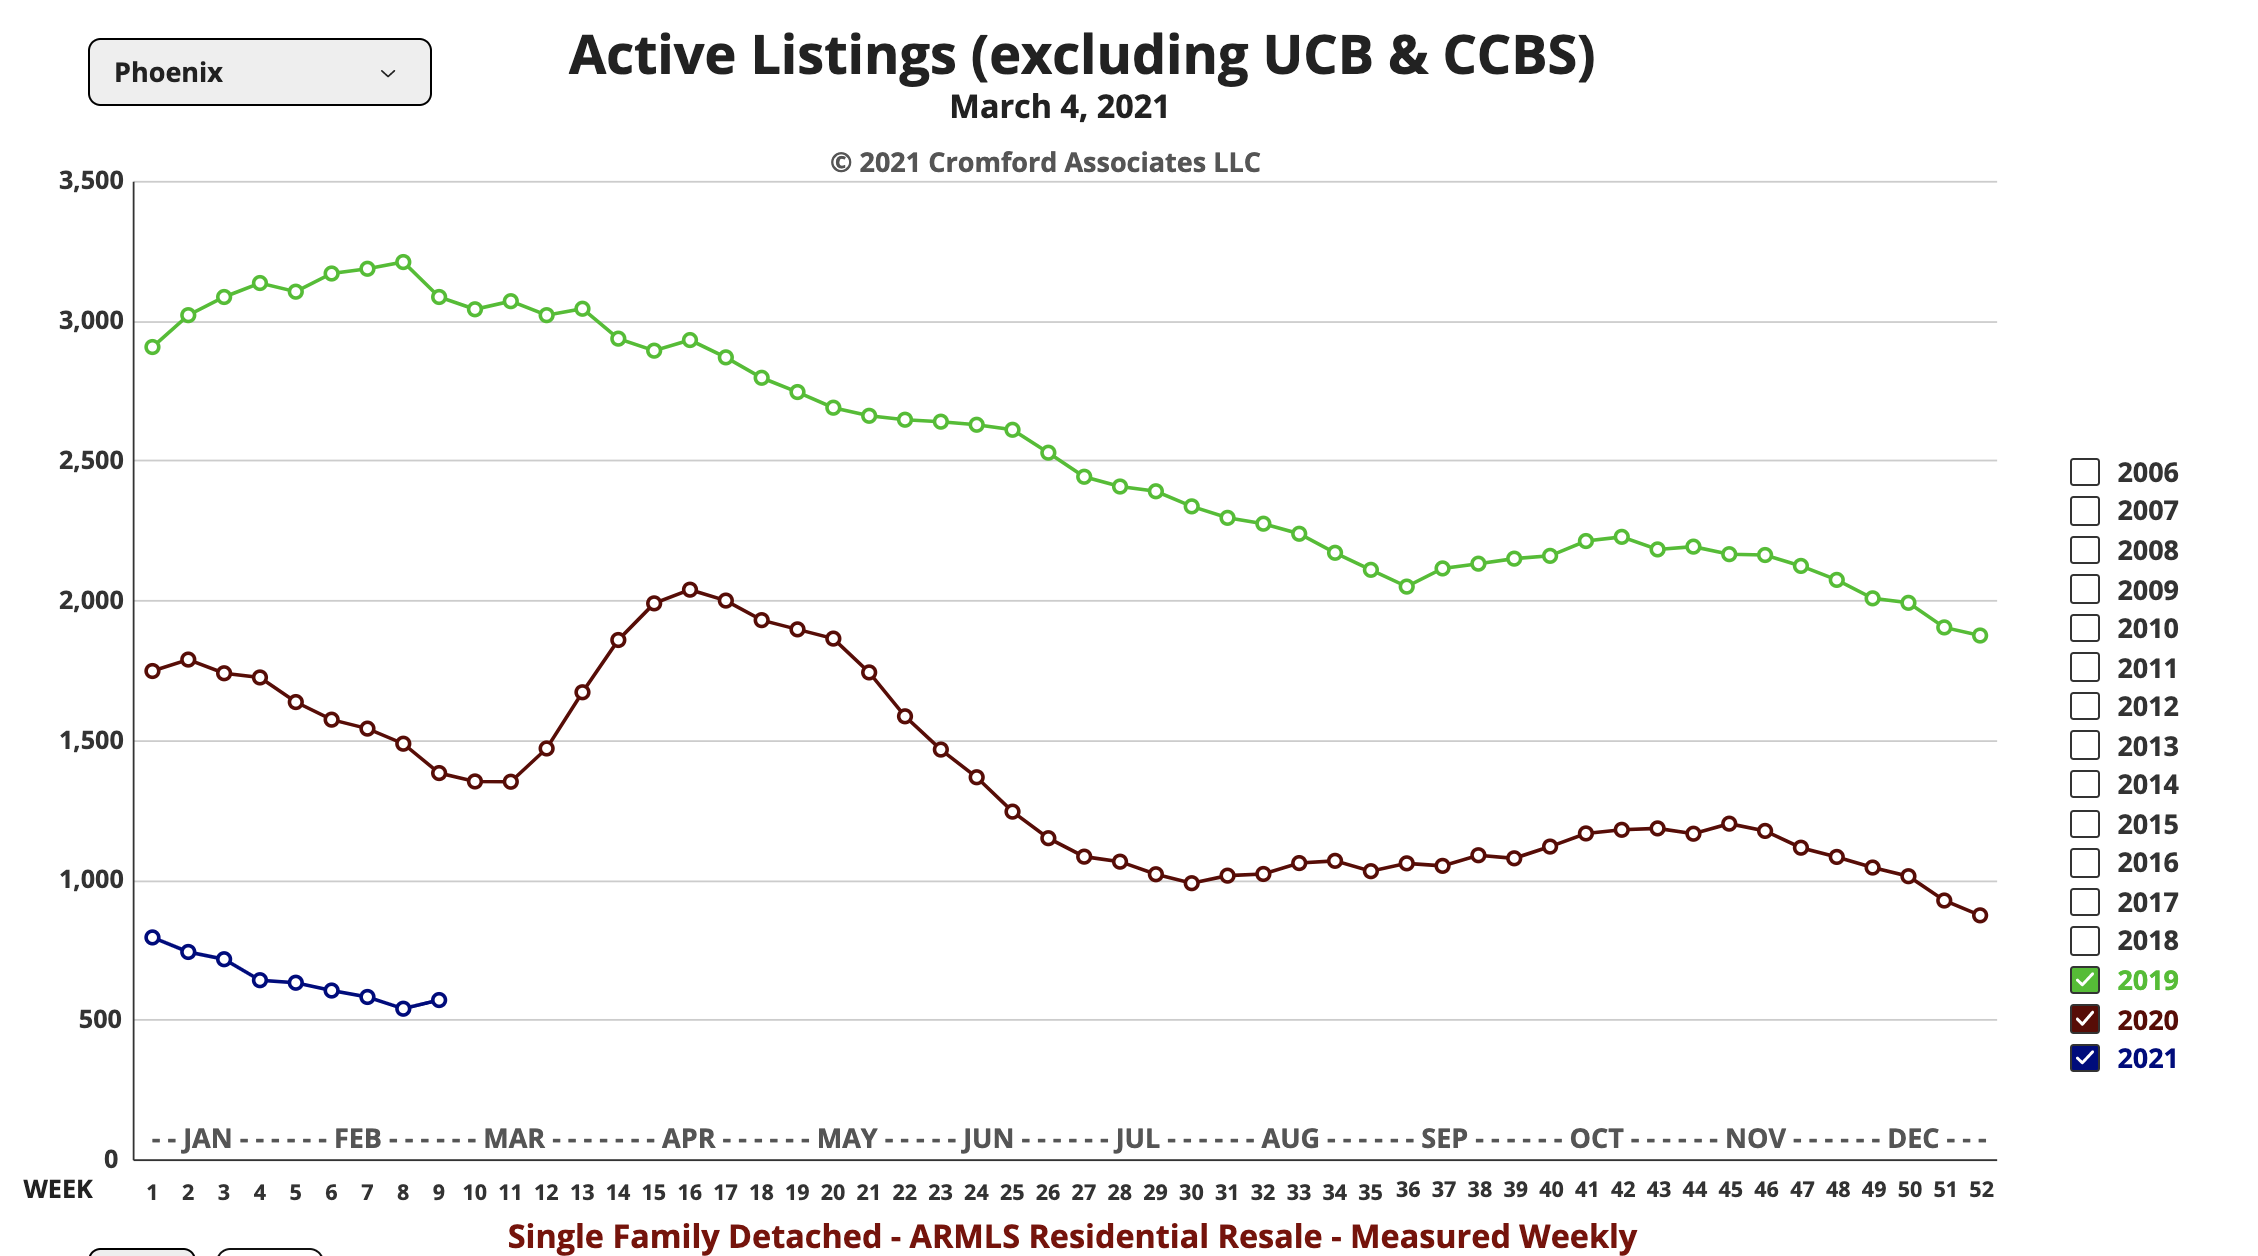
“In March 2020 we wrote that the lack of supply was making life extremely difficult for buyers. It is now down almost 60% since then. What phrase can we use to describe this – scorched earth?
The monthly sales count, pending listing counts and under contract counts are all higher than last year, but not by as much as last month. This confirms the downward trend in demand. Lower demand really does not make much difference when supply is this scarce. Even if demand dropped well below normal we would still have multiple offers for most listings.
Multiple offers are the mechanism that drives prices up. One offer per listing represents stability. No offers tends to drive prices down. We would need about 7 times the current supply to get back somewhere close to normality. (Emphasis added for my listing update.)
The full impact of the housing shortage is not being properly recognized, because many people incorrectly think the end of forbearance will bring a flood of distressed homes onto the market. We think this is very unlikely. While we can imagine a noticeable increase in supply taking place, it is very unlikely to reach the levels that would dramatically change the balance in the Greater Phoenix market. It is somewhat reminiscent of the “shadow inventory” theory of 2011 through 2013 which turned out to be a mirage, invented by a data analysis company that did not understand how to measure the foreclosure process properly. Their erroneous calculations were re-broadcast by the media and spread as if they were true. But it was all imaginary. There was no significant shadow inventory then and there is no huge wave of distressed homes waiting to hit the market now. Do not be taken in by these myths just because other people chose to believe them. Over the centuries many people have believed things that are now known to be false. It is still just as common today. In fact the internet and social media makes it even easier for falsehoods to become accepted as facts.
Many people also seem to have forgotten what really happened during the bursting of the housing bubble: The sequence is important.
- The active listing supply increased dramatically between April 2005 and December 2006 due to over-building of new homes and the frantic speculative wave of 2004 quickly losing momentum
- Prices started to fall from July 2006 onward due to supply becoming much stronger than demand
- The fall in prices meant recent buyers had zero or negative equity from 2007 onwards, loosening their motivation to keep up their mortgage payments
- Foreclosures started to be filed starting in 2007 against homes that were quickly abandoned due to the lack of equity
- A huge wave of bank owned properties hit the market in 2008 and 2009, adding to the supply problem
- The lack of equity meant many homes listed in 2008 through 2011 were short sales.
- Investors pounced on the bank-owned homes and short sales from 2009 onwards, bringing the drop in prices to a complete halt by 2011
This is unlike the current situation. We have far too little supply, not far too much. Note that the excess supply in 2006 was the primary problem that burst the bubble. The foreclosures came later and were an effect, not a cause, of the bubble bursting.
This bears repeating – FORECLOSURES DID NOT CAUSE THE HOUSING CRASH – they were a consequence of the excess supply of 2006. Falling prices caused the foreclosures, not the other way round. It then became a negative feedback loop until prices fell low enough to attract speculators and investors back into the market in 2009. The housing crash was visible and inevitable by the fourth quarter of 2005, while foreclosure were still at normal levels.
In 2021, we are entering a period of extreme appreciation. We are measuring 23.1% using the monthly $/SF figure and this is quite mild compared with what we expect to see in 2 or 3 months time. The average price per square foot for closed listings rose almost 5% in just 4 weeks during February.
Dollar volume is at very high levels for the time of year, thanks to unit sales up 7.4% and pricing up 23.1% compared to a year ago, when the market was already at full steam ahead.
We expect to see dollar volume hit new records during the second quarter, along with all of the pricing metrics.”
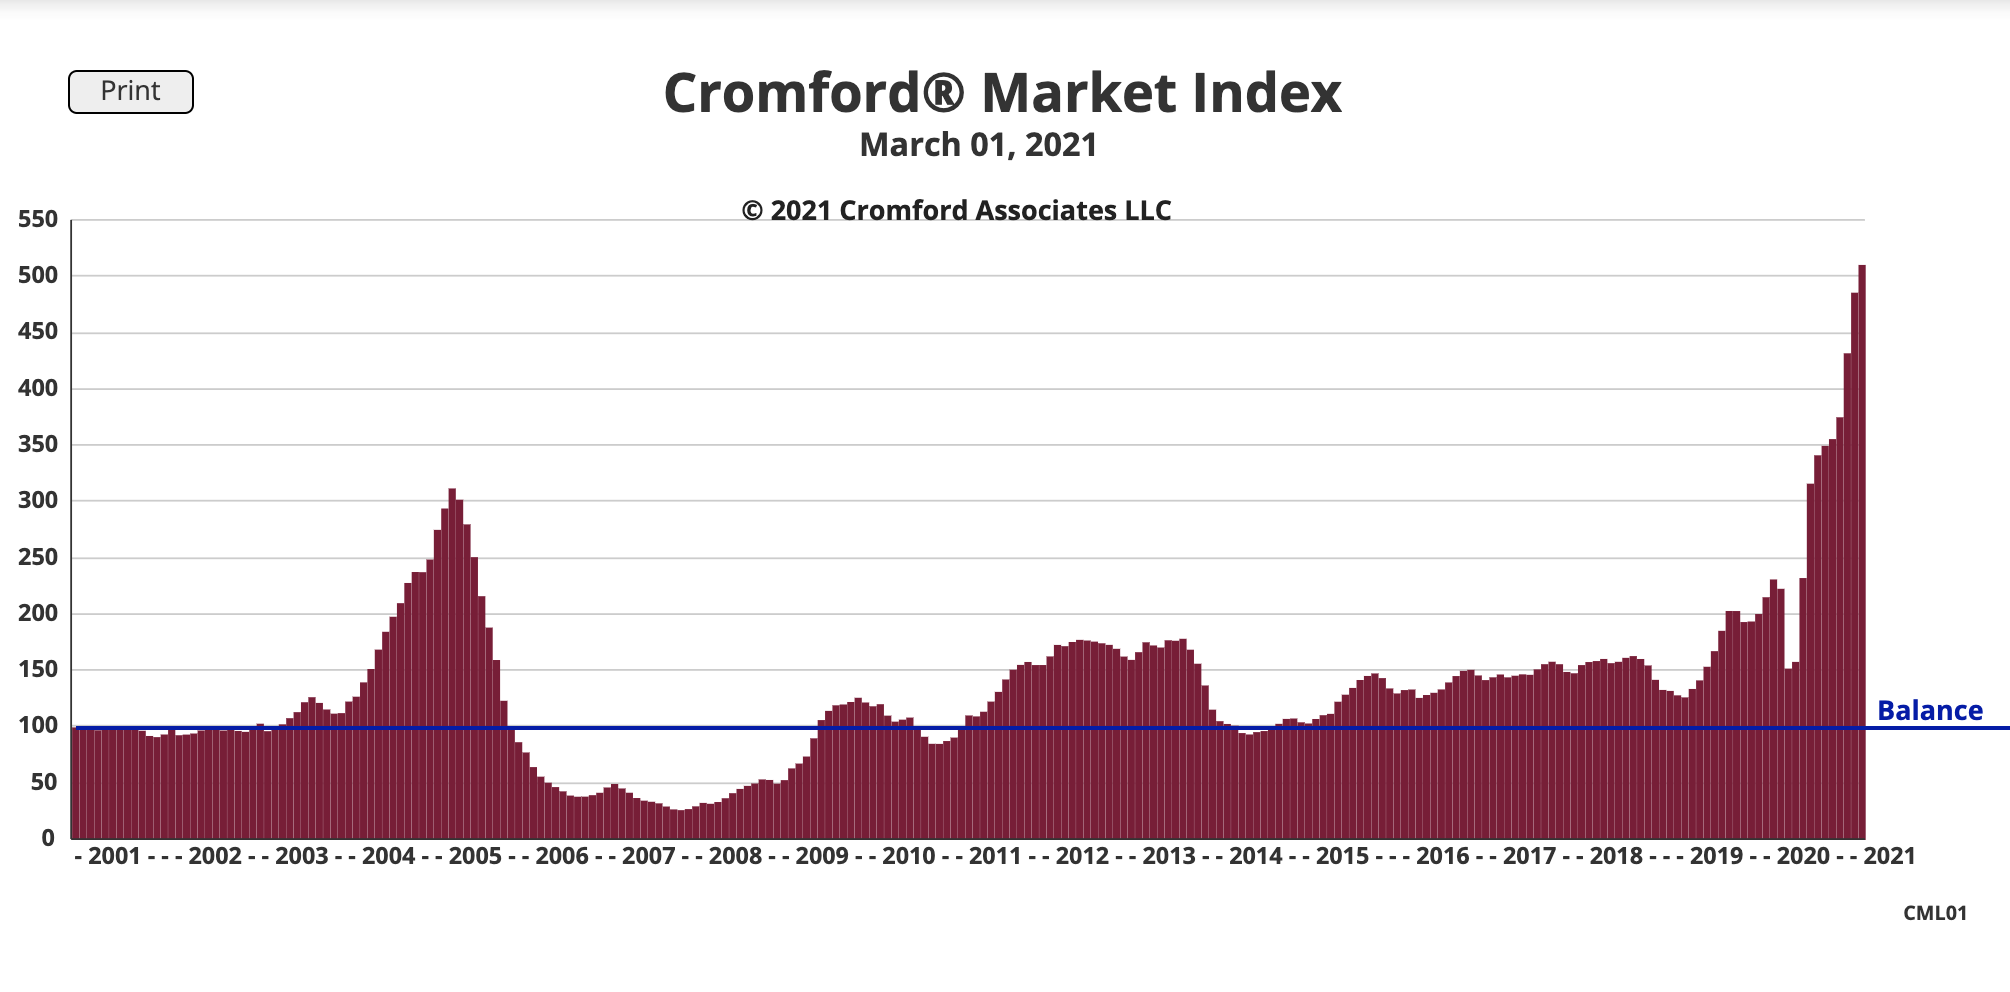
Back to a note from me for this market update. I’ve added the image, below, of the long term perspective of the Cromford Index. Look at how much higher we are now than we were prior to the great recession. Cause for alarm? It’s hard to tell. At some point, buyers will stop trying and sellers will decide to list. It has to come back in to balance, but I doubt that means prices will drop any time soon.
If you want analysis outside of this monthly market update for your particular situation, give us a call at 602-456-9388.