
So, if you needed more data to show that the market and demand is strong now, as opposed to how it looked in late 2018, have a look at this quote and chart from the Cromford Report.
“Listings under contract is a great measure of demand. We typically see a seasonal pattern to listings under contract and 2018 was no different – except it was. 2018 started off following 2017 demand pretty well but in August of last year demand started to fall. We ended 2018 with 19.1% fewer deals in escrow as the previous year. That trend continued until the end of March when demand started to spike. Buyers came back and we’re now 8.2% above last year and nearly tied with 2017. Whew.”
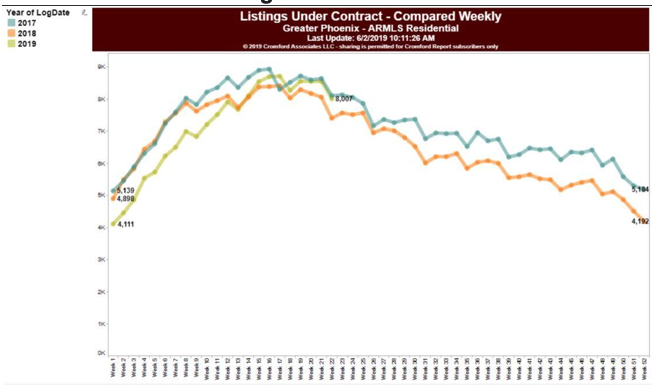
According to Cromford, “The weaker demand that started in 3Q 2018 and ran through 1Q 2019 has caused a slightly slower rate of annual appreciation in recent months. However appreciation rates remain well above inflation and significantly above percentage rises in earnings.”
So, what does that mean for you? Well, if you are selling you can see that properties under contract tend to drop off after June of every year. So, you could really stand out.
If you are buying, then expect less inventory to choose from, but perhaps an opportunity to make a deal if the properties are not moving.
Just watch out for flipped properties. We know that those wholesale buyers often reduce prices of homes they purchase by presenting sellers with long lists of repairs needed, but we don’t know if they did all of those repairs.
Call us to navigate this world of wholesale scams and trickery. 602-456-9388.


