It’s gonna be a shortage for a while, although things seem to be getting better as more people throw listings on the market and demand is softening. So, for now, I’m still gonna call it the July Shortage Update. Here’s what the Cromford Report analysts are seeing this month:
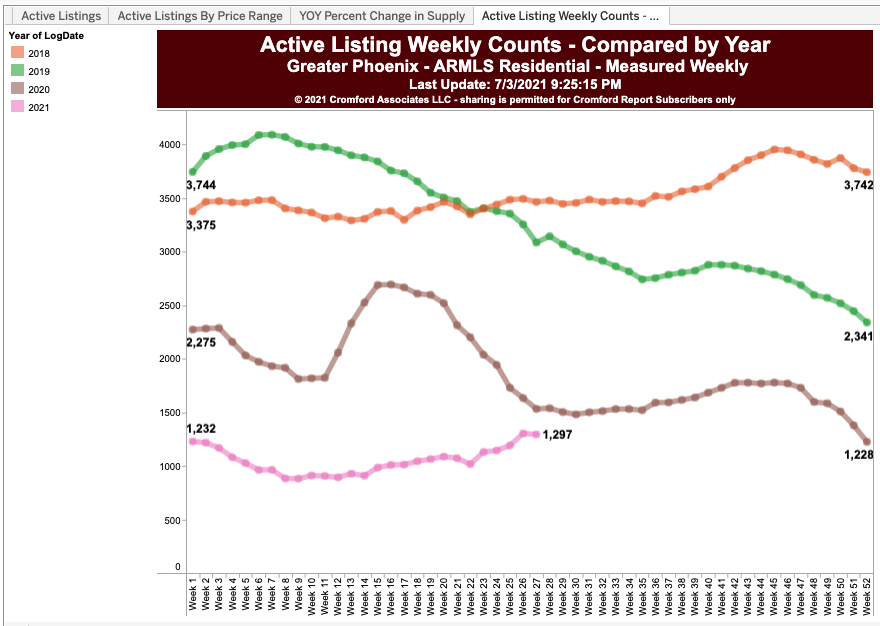
- Active Listings (excluding UCB & CCBS): 5,699 versus 8,788 last year – down 35.2% – but up 15.9% from 4,917 last month
- Active Listings (including UCB & CCBS): 9,783 versus 14,279 last year – down 31.5% – but up 4.5% compared with 9,361 last month
- Monthly Median Sales Price: $397,000 versus $305,000 last year – up 30.2% – and up 1.8% from $390,000 last month
“Supply is now on a clear upward trend, growing almost 16% from last month, though it is still down over 35% from this time last year and a very long way below normal. This upward trend is thanks to a strong flow of new listings and a decline in the rate of listings going under contract.
Demand looks strong when we look at the closed sales numbers, up 5% from last year and 5.6% higher than last month. However June 2021 contained 22 working days, 10% more than May 2021, so the number of closings per day was actually down 4% compared with last month. Demand looks very weak when we look at the listings under contract, which is the forward-looking element of demand. This count is down over 15% compared with this time last year and down almost 8% from last month. This is a clear signal that the rapid rise in prices is having the expected dampening effect on demand.
We expect sales rates to slow in the second half of 2021. We forecast that prices will continue to rise but at a slower pace than during the first half. These means that dollar volume will remain very high compared with historical numbers.
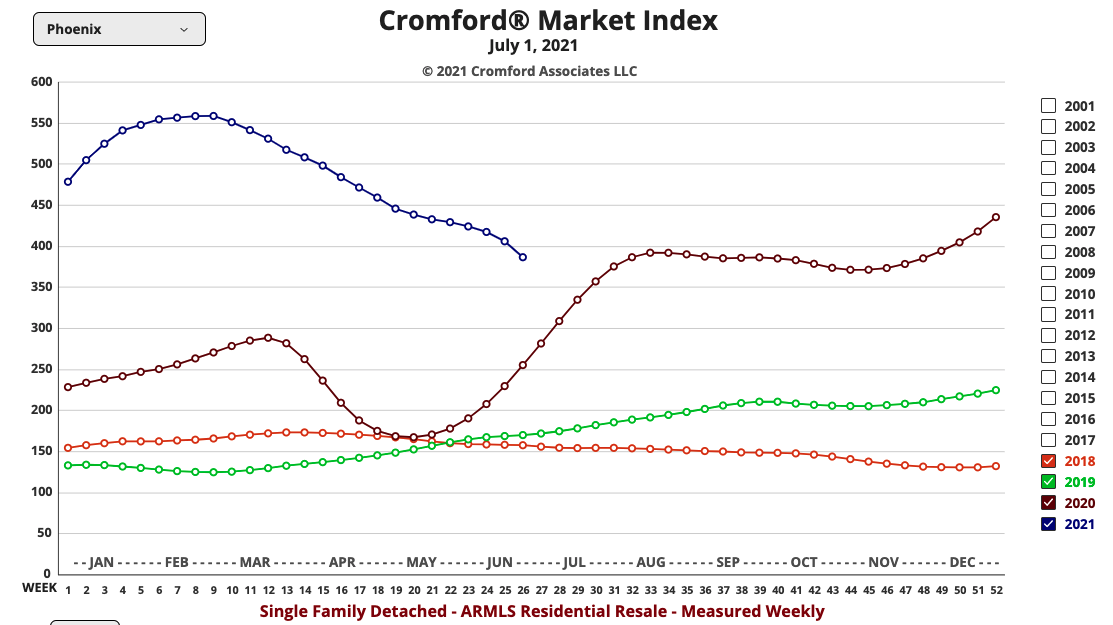
The CMI looks likely to fall well below 400, but the rate of decline will depend very much on the rate of arrival of new listings. The first several days of the July shortage are of little use as a guide because of Independence Day, but we should have a clearer picture of supply patterns by the middle of July.
We anticipate a growing divergence between the supply patterns of 2021 and 2005, since there were many thousands of empty homes held by speculators in 2005 which were listing for sale during the third quarter of 2005. We see very few of these speculative empty homes in 2021. In July 2005, we got 12,580 new listings across Greater Phoenix, far above the monthly rate we are seeing in 2021. There have been 58,109 new listings across Greater Phoenix during the first 6 months of the year.”
Anecdotally, we are seeing some folks listing above market, hoping that they can grab some extra cash. We think this strategy can backfire even in this July shortage. While the market is hot it is also very fickle. When we have seen people list too far above market, they don’t get the feeding frenzy that people expect to see right now and then their property becomes stale very quickly. In other words, it is better to list where you are likely to get multiple offers and competition than list too high and people think there is some reason the property did not sell in the first week.
NOTE: The Cromford Index now below 400 since the first time last year. Watch that to continue to drop! See below. Now is the time to list.
Call us if you’d like to strategize your market entry at 602-456-9388.