
For this market update our friends at the Cromford Report are showing a continuation of what we have been seeing for much of 2019 — the number of active listings has been going down, prices are continuing to inch upwards, and the months’ supply has been decreasing.
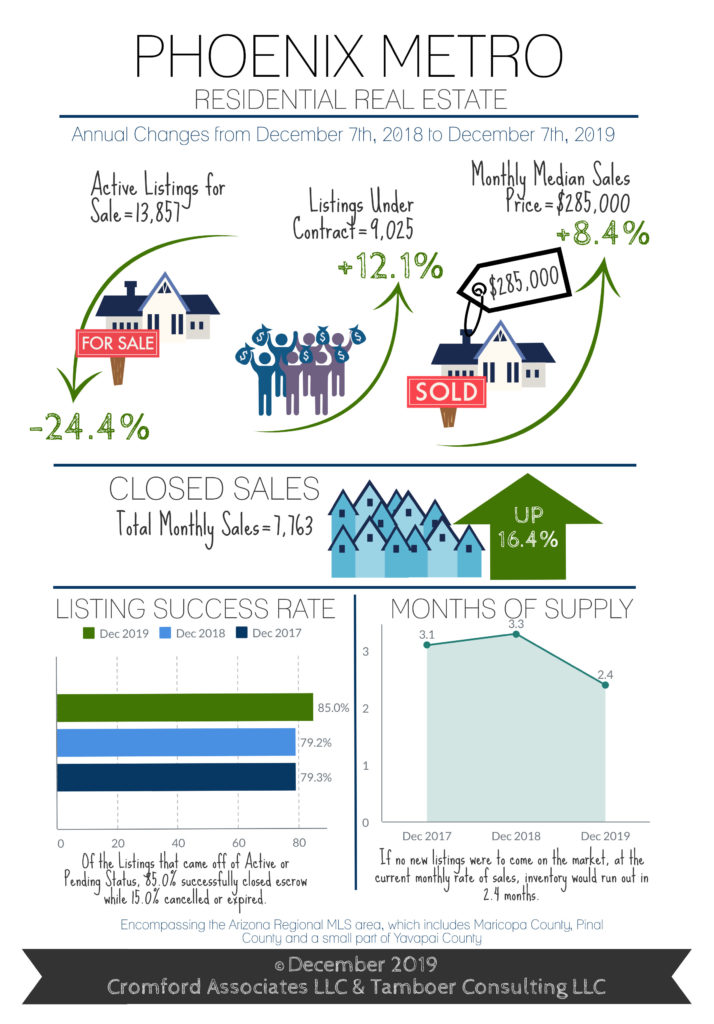
By the way, when we talk about “months’ supply”, we are talking about how many months we could sell homes if no more homes came on the market today. So, we could continue selling homes for 2.4 months from today if no more homes were to come on to the market.
Notice on the graphic that it is down as compared to the last two months.
However, that can be misleading if you look at it out of context.
Have a look at this next graphic and compare 2019 to 2018. Sure, supply tends to go down at the end of each year. However 2019 has a significantly smaller number of properties on the market.
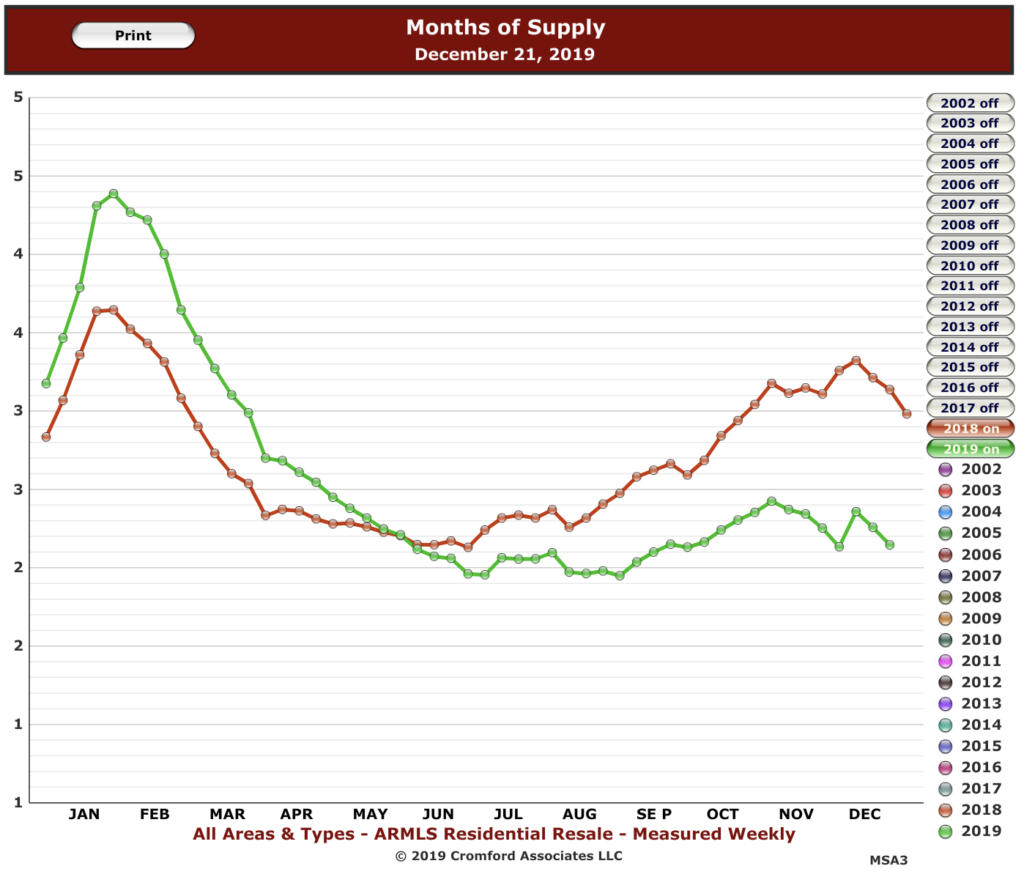
Were I to turn on 2016 and 2017 in this chart, it would be the same. 2019 has had the lowest supply since 2005.
So, as you might guess, this makes thing difficult for home buyers, especially in CenPho where there is hardly any new construction. We are seeing new construction in the suburban zones, for sure. But home builders are just not interested in the in-fill kind of projects that are needed in Central Phoenix.
Home builders would rather take huge tracks of land and put 200 homes on them, than find a couple acres in Central Phoenix where they may only be able to place 20 town homes.
Volume is the rule for these guys so that they can show a greater profit margin for their investors. So, whoever can figure out how to build in-fill at a profit will be king.
Or –and hear me out– maybe investors should not expect such high profit margins on in-fill constructions.
Boom! Mind blown!


