
We’ve been checking in more regularly on the market, of course. This market watch is supporting what Michael Ore of the Cromford Report was predicting, as reported in our last regular market update.
Here are some highlights of that:
The valley housing market has changed much less than you might expect.
While there have been some negative trends, sales prices are still rising and the affects have been lesser than other economic sectors.
Comparing April 1 of this year to April 1 of last year:
- Active Listings (excluding UCB & CCBS): 13,211 versus 18,650 last year – down 29.2% – but up 20.1% from 11,003 last month
- Under Contract Listings (including Pending, CCBS & UCB): 10,152 versus 11,707 last year – down 13.3% – and down 15.3% from 11,988 last month
- Monthly Sales: 8,840 versus 8,489 last year – up 4.1% – and up 18.2% from 7,476 last month
- Monthly Average Sales Price per Sq. Ft.: $186.47 versus $172.01 last year – up 8.4% – and up 0.8% from $184.94 last month
In summary, supply went up, demand came down, sales remained strong and prices went up.
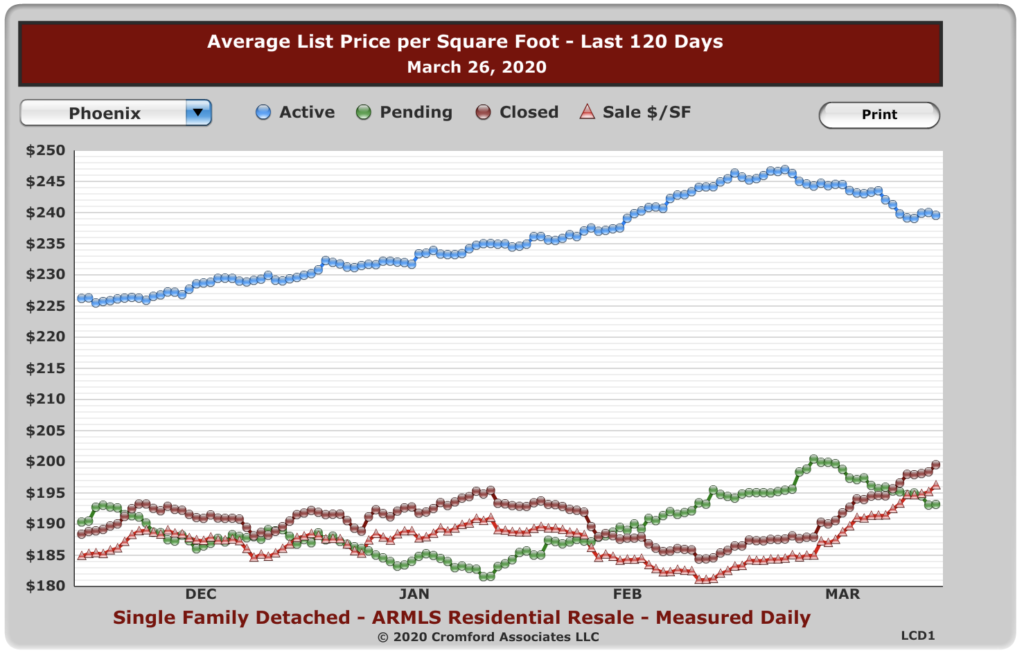
So, look at this market watch chart. It is showing that list prices are coming down over the last few weeks, which makes sense. People are worried. But the key here is that sales prices are still going up.
If that does not speak to what is going on in the market, I don’t know what does. There is still scarcity and people still need homes.
At the very least, predictions that the real estate market will crash like the stock market are simply not turning out to be true.


