Get Your PHX - A Whole New Way to Experience Phoenix
  • Home
  • Our Blog
  • About Us
  • Contact
Get Your PHX - A Whole New Way to Experience Phoenix
Home
Our Blog
About Us
Contact
  • Home
  • Our Blog
  • About Us
  • Contact
Blogroll, First Time Home Buyer, Live, Market Analysis

August Market Update

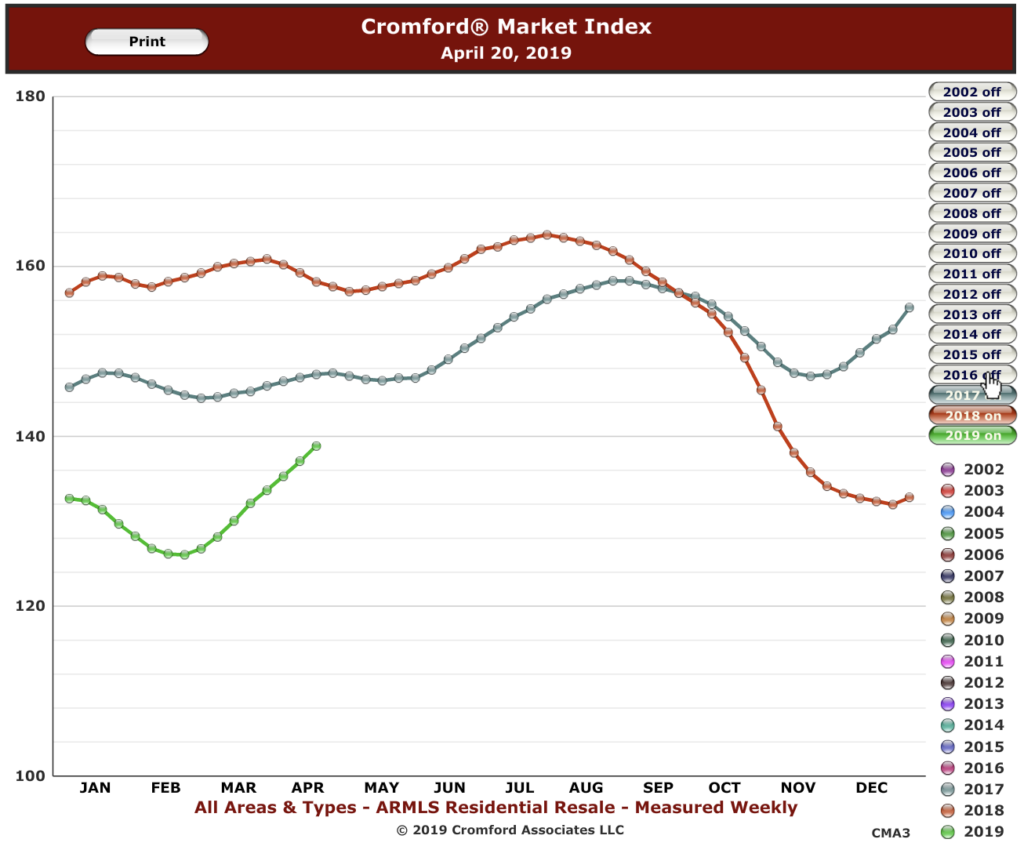
A funny thing happened in July and it may affect the August market update.

Well, “funny” may not be funny for buyers.

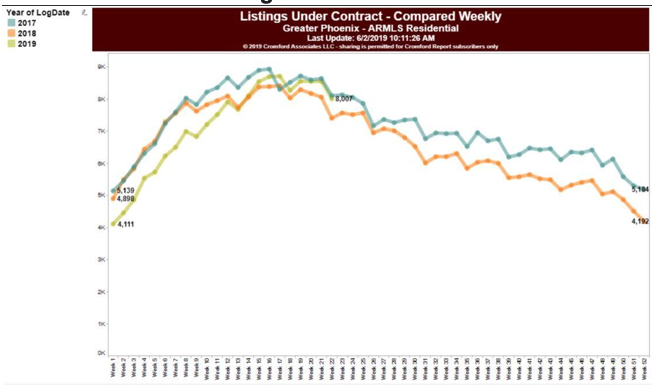
Look at this chart of new listings that come on every day in July, compared over several years.

It’s hard to see, but there is a light blue line at the bottom of the grouping of lines, with the number 6,119. That represents the number of new listings in Maricopa county that came on in July.

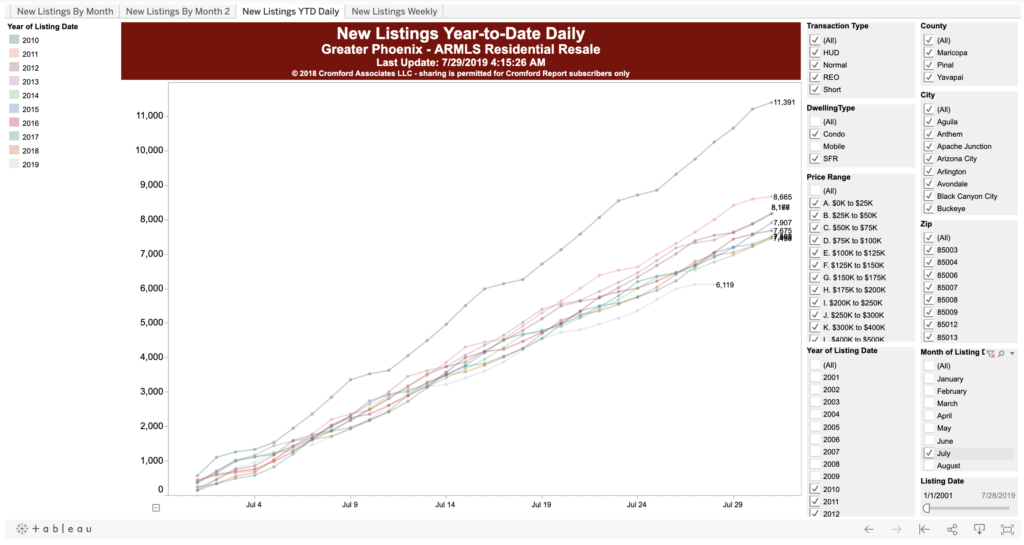
Notice that the July 2019 number is at least 1,000 listings lower than the next closest line. So, we have had fewer listings coming on the market this July than any July since 2010.

I also turned on all years available in the system and it is the lowest July since 2001 –and there were fewer houses in the valley back then.

Now, when you look at just listings above $500,000, that difference disappears. But it is strong for homes under $500,000.

What does that mean? Should we be alarmed?

Well, we don’t know yet. (Sorry to those of you who like certainty. You won’t get it on this one.)

It could be a blip. This trend started in June and it could disappear in August. We need to watch it.

If it continues, then those of you who are thinking of listing your home should go ahead and list (especially those at or below $500,000). There is scarcity in the market in that case and it gives you an advantage. Further, people need homes, so they will be looking.

If you are a buyer, be patient, as it may take you a while to find what you need. Also, be ready to go see a house and write an offer immediately if you like the home.

There is still a scarcity in the market and this just happens.

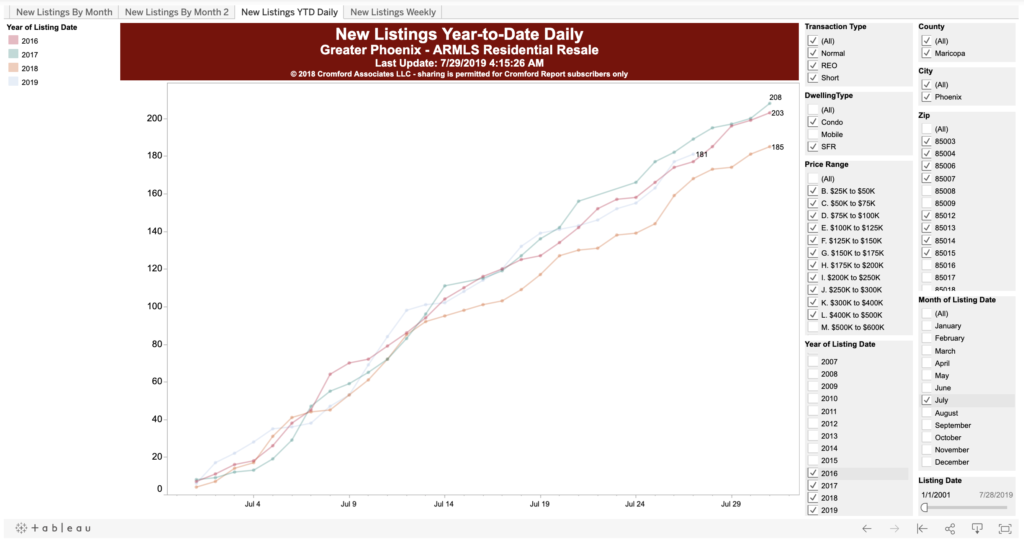
NOTE! This dynamic does not seem to be happening in the CenPho historic zip codes. See the chart below. So, for these zip codes, the July listing numbers seem to be right in line with previous months.

So, if you need to build a strategy around selling or buying, please call us at 602-456-9388.

July 29, 2019by phxAdmin
Blogroll, First Time Home Buyer, Live, Market Analysis

Top 5 Myths of the Get Your PHX Team

Over the 11 years that I’ve been in business and the 6 years that Michelle Conley and I have been working together, we hear a few misconceptions more than once. They are not major issues, but I figured it’s worth correcting the record.

These misconceptions start with, “Oh, I thought you…”

So, just in case you were wondering, here we are to correct the record.

  1. “Oh, I thought you only sell houses in… <insert one>, the historic neighborhoods, or downtown or in Central Phoenix.

    Fact: We work all over the valley, even though we specialize in historic.

    Further, we have relationships with quality agents all over the state. We are also building relationships with agents in other states, so we can get you the help you need.
  2. “Oh, I thought you didn’t have time for real estate because of your political work.”

    Fact: I never stopped being a full-time professional realtor, all through my recent years in office. Thank goodness for Michelle Conley, who made certain the trains ran on time on those days when the legislature ran late.

    Regardless, I’m not in public office now. So, we are ready to help you!
  3. “Oh, I thought I could sell that house for 1% commission, so I did not call you.”

    Fact: Most times, that “1% commission” turns into much higher costs to you. Plus you won’t have somebody to protect your interests. See my short video that details how those big wholesale buyers are taking advantage of sellers.
  4. “Oh, I thought it would be easier to just purchase a home through the website because I don’t like dealing with people.“

    Fact: If you don’t have somebody to protect your interests, you are increasing the chances that the sellers will take advantage of you. You’ll definitely have to deal with people when you find out that there was major damage to the property, which was not repaired before they sold the house to you.

    Why pit yourself against people who have bought and sold hundreds of homes without protection?
  5. “Oh, I thought realtors don’t do much work and just make tons of money. They sell a house and buy a new Mercedes.”

    Fact: Some are rolling dough, but very few. Realtor income looks much like the entire population: very few gobs of money, but most earn a modest living.

    Further, in order to be a quality agent we must invest years in to the trade and local knowledge. Further, typically, we sell homes that look like the community we live in.

    Regardless, there is a great deal more work that goes in to each transaction than most people know: needs analysis, market analysis, lending advice, neighborhood knowledge, smart home searching or listing marketing, negotiations, inspections, vendor coordination, closing preparation and post-closing availability.

So, we stand ready with decades of combined experience to help you meet your needs. Call us at 602-456-9388

June 20, 2019by phxAdmin
Blogroll, Live, Market Analysis

July Market Update

“So, will there be a slow-down in the market over the summer,” people ask us almost every day.

You might think that it would, since it’s hotter than a snakes butt in a wagon rut. Who wants to look at homes?

Well, the answer is that the market in the summer typically looks much like it does the rest of the year.

If the market is hot coming in to summer, it will stay relatively hot. Sure, there are fewer people out there looking and typically fewer listings. But that does not mean that the number of sales changes much.

There seem to be fewer listings going in to this summer than there were last summer. That could be good for sellers and bad for buyers, but that also depends on the quality of the inventory, as we learned last year.

According to the Cromford Report, sales prices are continuing to climb slightly every month:

“Our mid-point forecast for the average monthly sales $/SF on June 15 is $173.61, which is 0.8% above the June 15 reading.

The average $/SF has been stronger than predicted over the last 5 months, and this has been largely due to the mix of homes that closed. High end homes were better represented than expected between January through May. The average $/SF for pending listings has risen again over the last month so we are expecting another gain in average $/SF over the next 30 days.”

Interest rates are also still floating just under 4%. So, there is no panic in that regard.

The tight inventory and low rates could be why the Cromford Index is going in to the summer looking like a rocket. Sellers don’t have as much competition and there are more buyers, attracted by low interest rates.

So, what does this market mean to you? If you are a seller, make your home look great and don’t be afraid to list during the summer. If you are a buyer, you might be able to take advantage of other buyers being away; this is a strategy that may work better in other parts of the valley than in others.

If you need help building a strategy, contact us at 602-456-9388.

June 20, 2019by phxAdmin
Blogroll, First Time Home Buyer, Live, Market Analysis

Listings Under Contract

So, if you needed more data to show that the market and demand is strong now, as opposed to how it looked in late 2018, have a look at this quote and chart from the Cromford Report.

“Listings under contract is a great measure of demand.  We typically see a seasonal pattern to listings under contract and 2018 was no different – except it was.  2018 started off following 2017 demand pretty well but in August of last year demand started to fall.  We ended 2018 with 19.1% fewer deals in escrow as the previous year. That trend continued until the end of March when demand started to spike.  Buyers came back and we’re now 8.2% above last year and nearly tied with 2017.  Whew.”

According to Cromford, “The weaker demand that started in 3Q 2018 and ran through 1Q 2019 has caused a slightly slower rate of annual appreciation in recent months. However appreciation rates remain well above inflation and significantly above percentage rises in earnings.”

So, what does that mean for you? Well, if you are selling you can see that properties under contract tend to drop off after June of every year. So, you could really stand out.

If you are buying, then expect less inventory to choose from, but perhaps an opportunity to make a deal if the properties are not moving.

Just watch out for flipped properties. We know that those wholesale buyers often reduce prices of homes they purchase by presenting sellers with long lists of repairs needed, but we don’t know if they did all of those repairs.

Call us to navigate this world of wholesale scams and trickery. 602-456-9388.

June 5, 2019by phxAdmin
Blogroll, First Time Home Buyer, Live, Market Analysis

More Buyers Should Beware

In the last few months I’ve been on a tirade.

I’m very concerned about how wholesale buying companies are, in my opinion, creating consumer protection issues. You know the companies I’m talking about. Their ads are everywhere.

I’m not going to give them a free plug. But you know them. These are the guys who promise to buy your house quickly and you pay “only 1% commission,” or some such nonsense.

Watch this short video on how previous clients sold their home, thinking they would pay about 1% commission, but ended up giving up about 9.4% in order to sell.

So, I’m not letting it go here. I’ve published three more videos that go in to greater detail about how these companies are mis-leading consumers.

  1. The first video goes in to the reasons these companies give for you to use them. Hint: they are bogus.
  2. The second video takes a deeper look at what “fiduciary responsibility” is, why a realtor has that responsibility to you and how these companies get around it, all while giving the impression that they are looking out for you.
  3. The third video explains how a “1% commission” can easily result in a 9% loss in your profit when you sell your home, if you are not represented.

“But,” I hear you say, “you’re just a realtor who’s afraid that your business is going away because there is a new business model, and you are not willing to adapt.”

Well, watch the videos and then call me at 602-456-9388. I don’t bite and I’d love to hear how this model in any way protects consumers.

These companies are literally having inspections and deducting repair costs off of the price of the home with little or no resistance from the seller.

They are locking sellers in to a process that goes against their interest after baiting them with the promise of low commissions.

That is about as close to a scam as I can imagine and I’m deeply disappointed that the Arizona Association of Realtors nor the National Association of Realtors (who’s job it is to protect consumers, they say) has not taken action to educate the public.

So, it’s left to me, my little camera phone and my little office.

Oh, and if you are a buyer and you don’t think this affects you, please consider that these houses are being sold with inspections that may not be honest and possibly repairs or renovations that have not been done.

Specifically, if the wholesale buyer does an inspection in order to force the price down, how do you know that they repaired all of those items? You don’t have access to the previous contract, do you? Plus, you will often see these properties sold “as-is.” If it was serious enough to warrant a price reduction, shouldn’t it be serious enough to repair for the next buyer?

If you need a real estate team that takes your interests seriously, please call us at 602-456-9388.

June 3, 2019by phxAdmin
Blogroll, First Time Home Buyer, Live, Market Analysis

Late-May Market Update

We are seeing upward pressure on prices, as the seller’s advantage strengthens again in the market.

The Cromford Index analysts think that the push upward will continue in to mid-June, although not drastically.

“For the monthly period ending May 15, we are currently recording a sales $/SF of $171.19 averaged for all areas and types across the ARMLS database.

Our mid-point forecast for the average monthly sales $/SF on June 15 is $171.96, which is 0.5% above the May 15 reading. We have a 90% confidence that it will fall within ± 2% of this mid point, i.e. in the range $168.52 to $175.40.

The average $/SF has been stronger than predicted over the last 4 months, and this has been largely due to the mix of homes that closed. High end homes were better represented than expected between January through April. The average $/SF for pending listings has risen again over the last month so we are expecting another gain in average $/SF over the next 31 days. The overall price trend continues to move higher, as is normal for the spring season, but we normally peak during the second quarter and then see some weakness for the following 3 months.”

So, in other words, the prices are on a solid incline. No spikes, from what we are seeing.

Seller’s advantage is dramatically improving.

What does this market update mean for sellers? It means that your position is stronger than it was at the end of last year. The decision to wait is really a function of what your other opportunities are.

Will an increase of 1% on the sale of your home if you wait a month be a better outcome than if you sold now and did something else with your money? Your call.

Buyers, don’t fear a steep price jump, but don’t expect that you can wait forever. Remember, there is still a scarcity of new construction in Phoenix, especially central and downtown.

June 1, 2019by phxAdmin
Blogroll, Live, Market Analysis

Mid-May Market Update

We are sharing with you the Cromford Report’s mid-May update, in its entirety because we simply can’t say it better.

Here’s the pull-quote take away: “Buyers waiting because they thought prices would fall have been left in the dust.”

We can bring this to you because we subscribe to their product. It is also what makes us better agents. Call us if you have questions about where the market is going at 602-456-9388.


Starting with the basic ARMLS numbers for May 1, 2019 and comparing them with May 1, 2018 for all areas & types:

  • Active Listings (excluding UCB): 17,513 versus 16,329 last year – up 7.3% – but down 6.1% from 18,650 last month
  • Active Listings (including UCB): 23,650 versus 21,440 last year – up 5.6% – but down 3.2% compared with 23,399 last month
  • Pending Listings: 7,326 versus 7,393 last year – down 0.9% – but up 5.3% from 6,958 last month
  • Under Contract Listings (including Pending, CCBS & UCB): 12,463 versus 12,504 last year – down 0.3% – but up 6.5% from 11,707 last month
  • Monthly Sales: 9,676 versus 9,185 last year – up 5.3% – and up 13.9% from 8,496 last month
  • Monthly Average Sales Price per Sq. Ft.: $171.80 versus $162.84 last year – up 5.5% – but down 0.1% from $172.04 last month
  • Monthly Median Sales Price: $270,000 versus $255,000 last year – up 5.9% – and up 1.5% from $266,000 last month

Last month we saw strong growth in listings under contract. This month we see strong growth in closed listings. This is why listings under contract is such an important number – it gives us early warnings of a change in the market. On this occasion the change is strongly positive for sellers. Sales are not only recovering, they actually exceeded April 2018 by 5.3%. Now those in the know are aware that April 2019 had a 4.8% advantage over April 2018, because it contained 1 additional working day. Many people tend to forget how significant the number of working days can be in retarding or advancing sales counts. But even allowing for that unfair advantage, April returned higher sales per day than April 2018. In fact April 2019 was the strongest month since 2005 for unit sales.

Currently the listings under contract count is almost the same as last year, so we should expect closed sales in May 2019 to be similar to May 2018. Both have 22 working days so this will be a fair fight.

New listings have been flowing a little more freely since March – we know sellers get encouraged by lower interest rates as well as buyers. However the new higher level of demand is making short work of the extra supply and active listings without a contract dropped over 6% during April. Supply is higher than last year, but it is falling more quickly than it did in 2018.

As we predicted, prices are rising, but at a slower pace than in 2018. The median sales price was up 5.9% compared with a year ago, while the average $/SF was up 5.5%.

Buyers waiting because they thought prices would fall have been left in the dust. The market continues to strengthen and the likelihood of falling prices in the near term is minimal. We have extremely low levels of distress, chronic low supply and the best buyers can hope for is that the appreciation rate will trend lower. We think that is a reasonable expectation, but it it shows no sign of turning negative. It would take a very different set of numbers from the ones above for that to be a possibility.

All in all, the market is more vibrant now than almost anyone expected it to be. This is good news for sellers, agents, title companies, lenders and developers. If interest rates start to rise again then we may see another mild slowdown, like we experience from September 2018 to February 2019, but at the moment the market engine is firing on all cylinders once more.

May 14, 2019by phxAdmin
Blogroll, Live, Market Analysis

The Contract Ratio is Looking Better

As we covered in the last market post, it looks like the market is not heading further toward “flat”, as we were thinking at the end of 2018 and the beginning of 2019.

One indicator of that is the Contract Ratio, from the Cromford Report. The ratio measures the number of completed sales contracts relative to the supply of active listings. If this number rises then it is a sign of growing contract activity and a positive signal for sellers.

In a balanced market for normal market segments, the value of the Contract Ratio is usually between 30 and 60. When it lies below 20 the market can be considered “slow” or a “cold market”. Above 60 can be considered a “hot market” and when it moves above 100 we regard this as evidence of a “buying frenzy”.

Well, compared to what we saw happening at the end of last year and the beginning of 2019, it looks like the ratio is strengthening. That’s a good sign, especially if you need to sell.

Close-up of chart

If you look closely at the chart, you will see that January, February and March of 2019 were significantly below those months in 2018.

In the case of January, it was getting dangerously close to “cold market.”

April 2019 is certainly not where April 2018 was, but we have made up a lot of lost ground in just one month.

So, what does this mean, especially since the high season in Phoenix typically ends at the end of June?

We think that, if you’ve been holding off on listing your house out of fear of a slow market, list it now! Your advantage is stronger and your chance of selling is better.

Get it on the market in time to get an offer before things begin to slow in June, as people think more about summer vacation and staying out of the heat than they do about purchasing a home.

In other words, this is about as good a definition of “opportunity window” as you can get.

Give us a call at 602-456-9388 and we can help build a strategy.

April 30, 2019by phxAdmin
Blogroll, Live, Market Analysis

May Market Update

It’s been a crazy last few months. At the end of last year, we saw signs that the market was flattening out. You might recall that the Cromford Index took a bit of a dive last year, and in to the beginning of this year.

But, around about the beginning of March, it began a healthy upward climb.

For those of you who follow our analysis, you know that the Cromford Index is a great predictor of where the market is going. It tracks a list of proprietary data, which we know includes things like price drops and seller concessions.

As such, it can confidently predict whether the seller’s advantage is slipping or gaining.

So, what does that mean?

It’s a particularly interesting question when you consider that sales price per square foot ($/SF) is still flat? According to the analysts at Cromford:

“For the monthly period ending April 15, we are currently recording a sales $/SF of $171.31 averaged for all areas and types across the ARMLS database. This is down 0.3% or 57 cents from the $171.88 we now measure for March 15. Our forecast range mid-point was $170.73, with a 90% confidence range of $167.32 to $174.14. The actual result was a little higher than the mid-point but well within the 90% confidence range.”

Part of this has to do with how long it takes houses to close. The homes that went under contract while the Index was dropping are now showing up as completed sales. To quote Cromford again:

“The average $/SF has been stronger than predicted over the last 3 months, but this was largely due to the mix of homes that closed. High end homes were better represented in January through March. The average $/SF for pending listings has fallen back a little over the last 2 months as the mix reverts closer to normal. The overall price trend continues to move higher, as is normal for the spring season, but we see April and May both lower than the March reading which was exceptionally strong.”

So, what does this mean for you? Well, if you were thinking of selling and you were concerned that your advantage was weakening, it is not.

Dire predictions of a flat market (from us, as well), were premature. Just bear in mind that “summer is coming,” and if you are selling you are better off listing before people leave for cooler climates.

If you are buying, you definitely want to get in now before prices go up. This is particularly true if you are looking in CenPho. As we’ve discussed in past blogs, the maddening pace of building of apartments and the anemic construction of owner-occupied properties in this area could create a shortage-like condition.

It is almost impossible to find a home under $300,000 in Cenpho, unless it needs major renovation. There are townhouses and condos, however.

Contact us for more information and targeted market analysis at 602-456-9388.

April 24, 2019by phxAdmin
Blogroll, Live, Market Analysis, Tips

The Problem with iBuying and Wholesalers

You might have seen my rant last month about wholesale buyers. These are the people who promise that they have a buyer for your house, cash, and that they will manage the sale for just 1% commission.

In my video, which you can see here, I broke down how one couple paid effectively 9.4% to sell their house.

Don’t get me started…

I’m looking for more examples of this as I am very concerned that people are not only losing their money, but they are opening themselves up to possible future lawsuits because they did not have a realtor to protect their interests.

There are really two types of deals that are lumped in to the term “ibuyers”. The first, covered above, are the companies that buy wholesale with the promise of lower commissions, usually leaving sellers without somebody to protect their interests.

The other type is commonly referred to as “al la carte” websites. Imagine AutoTrader, but for people selling their homes. It’s a different concept. Rather than you selling (unrepresented) to a buyer through their buyer’s agent at a lower commission, these sites are kind of do-it-yourself home sales.

What they promise is that you will pay only a flat, low commission. What you get may be something else entirely.

Before I get in to it, I want to say that ibuyer sites may not be the worst thing in the world if you are selling a home under $200,000 and you’ve been educated about the most important legal aspects of buying and selling a home.

Heck, if I thought I could create a website where I could also empower you while you sell your house, I’d be tempted to make it.

Regardless, if it meets your interests and you are sure you have the knowledge to do it right, go for it.

But, for now, there are important things to keep in mind.

  • What are you being charged? According to our broker, sometimes commissions from 6% to 13% can be added, as we saw above with wholesalers. Read the fine print! Here’s a summary from our broker.
  • Does the ibuyer website give you important information about disclosures, your liability and your responsibility. From what I’ve seen so far, they kind of just throw the paperwork at you and say “here are some basic instructions, go at it!” On one site I saw, it just instructed you do meet federal fair housing guidelines. Well, do you know about the six protected classes and how to make certain you are not discriminating against any of them?
  • Is the valuation correct? What process does the ibuying site use to value your house? Can you set your own price? Licensed realtors are trained to do comparative market analysis and take in to account local expertise, which algorithms don’t necessarily pick up.
  • What services do you think you are getting and how much will it cost to get better service? The range of services goes from just listing your property with no other service, to getting you to pay for add-ons, such as photography, signage and (probably computer-driven) marketing. What will it cost if you decide that you can’t do it all yourself?
  • What do you know about the agent you are assigned and how much time does he or she have for you? You will be assigned to an agent, who is probably sitting behind a desk, getting paid a lower wage and helping 20 clients all at once. At the rates the charge, the only way to make a living is through volume, which means your needs matter less. It’s kinda like those 5-minute doctor visits we all love so much. Nope! No more time for you!
  • Who will have your back if you are up against a more experienced agent? Just because you are assigned an agent on the seller’s side, does not mean you can match the experience or knowledge of the agent on the other side. Some services are so trimmed down that you do all your own negotiating. Even if that over-worked agent can negotiate on your behalf, do you think he or she will really fight hard when there are so many other clients to get through in a day?
  • Does the agent assigned to you have knowledge of your local market? This is a huge deal, especially in historic neighborhoods and dense urban areas. I don’t care how crafty a computer algorithm is, it probably does now know the word on the street about that big development coming in at the end of your street, etc.

What is missing in all of this is the personal connection with an agent who specializes in an area or type of home and who will spend time with you –not just some limited instructions.

Just beware. You get what you pay for.

If you have experiences with wholesalers or a la carte sites, and you are willing to share, please let give us a call at 602-456-9388.

April 2, 2019by phxAdmin
Page 1 of 251234»1020...Last »

Subscribe to Our Newsletter

We keep your data private and share your data only with third parties that make this service possible. Read our Privacy Policy.

Thank you! Please check your inbox or spam folder to confirm your subscription.

Categories

  • Art
  • Blogroll
  • Design
  • Editor's choice
  • Events General
  • Events GYP
  • Fashion
  • Featured
  • First Time Home Buyer
  • Homes
  • Life
  • Light Rail
  • Live
  • Market Analysis
  • NeighborhoodVideos
  • Phoenix News
  • Photography
  • Photoshootings
  • Profiles
  • Public Policy
  • Renovation
  • Renting
  • Restaurant Reviews
  • Sustainable Living
  • Tips
  • Uncategorized


© 2015 copyright GET YOUR PHX ® // All rights reserved // Privacy Policy