It’s been a while since I’ve just laid it all out there for you. The market data, that is.
I did this several times last year. Back then I was predicting that prices were going up during 2009…and I was right! (Just had to say it.)
Here are some of the most telling stats.
1) Prices
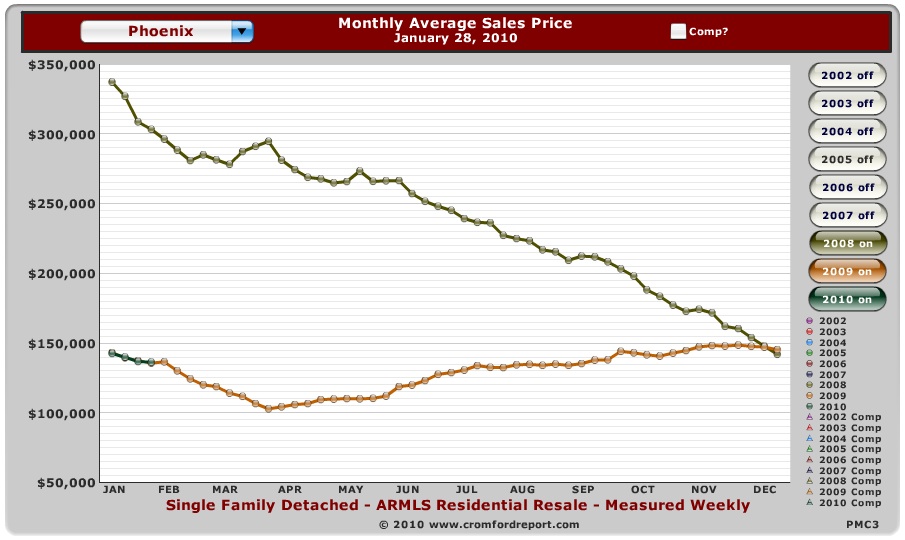
Prices are dropping in the first months of the year. I believe that some of that price drop has to do with the fact that you can’t get FHA financing on most condominiums, due to a change in policy last October. I believe that prices will level off and start going up by April, when people will begin to scramble for the $8,000 tax credit again.
In the chart below, look for the green line that is right on top of the orange line. That is 2010, right on top of 2009.
If you did not see it, review my article on the impact that interest rates have on price reductions.
2) Number of Sales
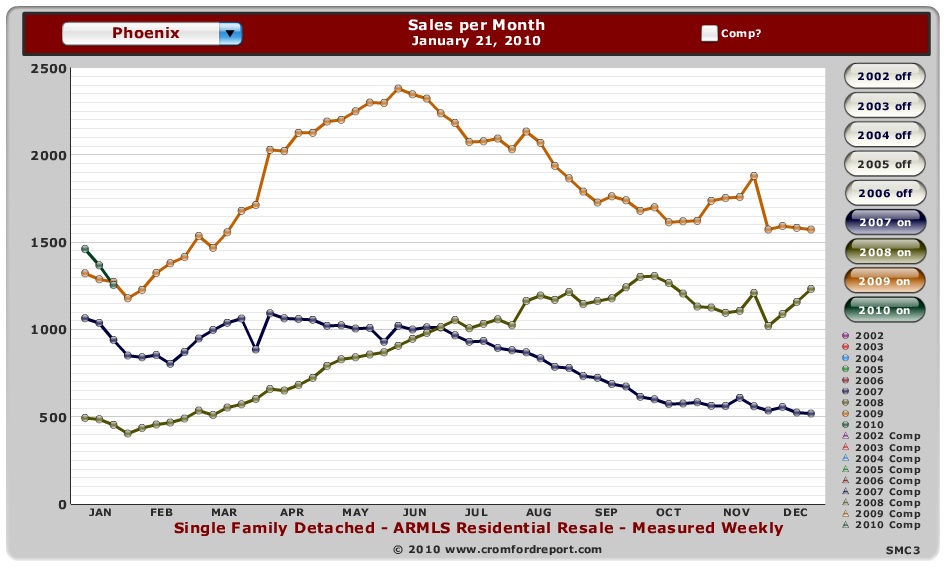
Now this is interesting. The number of sales is going down while the prices are going down, too. Does that mean that nobody is buying houses, despite the lower prices? Actually, it means two things. First, the number of sales always goes down for the first two months of the year. People came back from the holidays, rubbed their eyes, blinked and got down to the business of buying/selling. Those folks that got started in January/February closed in March. Happens every year. See below. Watch for sales numbers to go up in March and April.
Second, it means that people in March are going to start reacting to the lower prices and will start rushing in the market.
3) Market Distress
This is a really great way to see what is actually selling. Everybody has been talking about an impending wave of foreclosures. I have not seen it yet and we probably won’t. The banks want to sell homes at a regular pace. They don’t want to flood the market so that prices go down further!
Notice in the charts below that short sales (“pre-foreclosed homes”) are a smaller percentage of the market of “active listings”, but they make up a minority of homes that actually close. So, while I am happy to help my clients find short sale listings, I am careful to interview the listing agent to see if they have the knowledge and gumption to get through the bank’s process.
4) Interesting Note
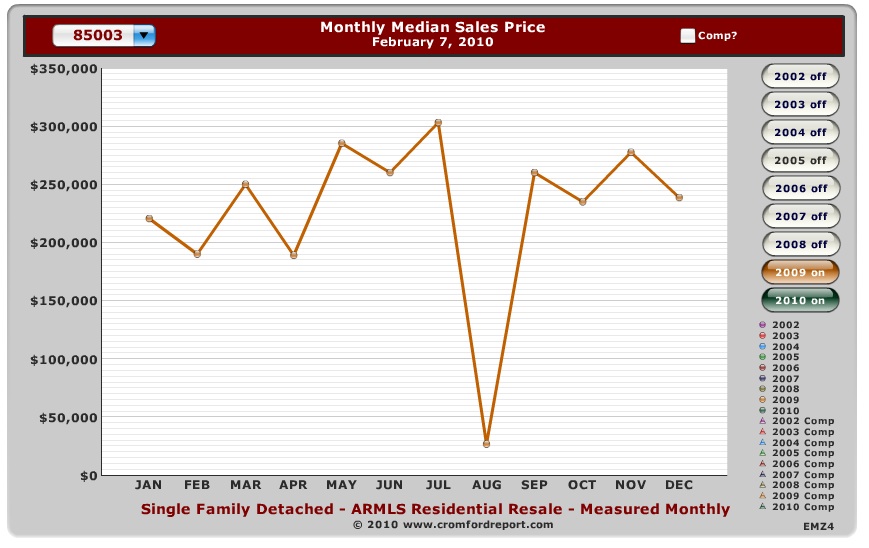
Have a look at this chart of annual sales for just 85003. Interesting how much that can fluctuate from just one sale, there in the middle. Fewer sales to average out the numbers. However, also note that the average sold prices have been much higher than other parts of town. Lesson: historic neighborhoods have kept their value!
Interesting stuff. It’s good to grab these snapshots. If you want more information in more specific areas, please let me know.


Leave a Comment