
For the monthly period ending May 15, our friends at the Cromford Report were recording a sales $/SF of $142.50 averaged for all areas and types across the ARMLS database. This is up 1.8% from the $139.96 we now measure for April 15.
 In most years, prices make a lot of progress between March and June so they think 2 months of strong advance from April 15 to June 15 is a very reasonable expectation.
They also expect a retreat to occur between June 15 and September 15, because this is a seasonal pattern that occurs almost every year.
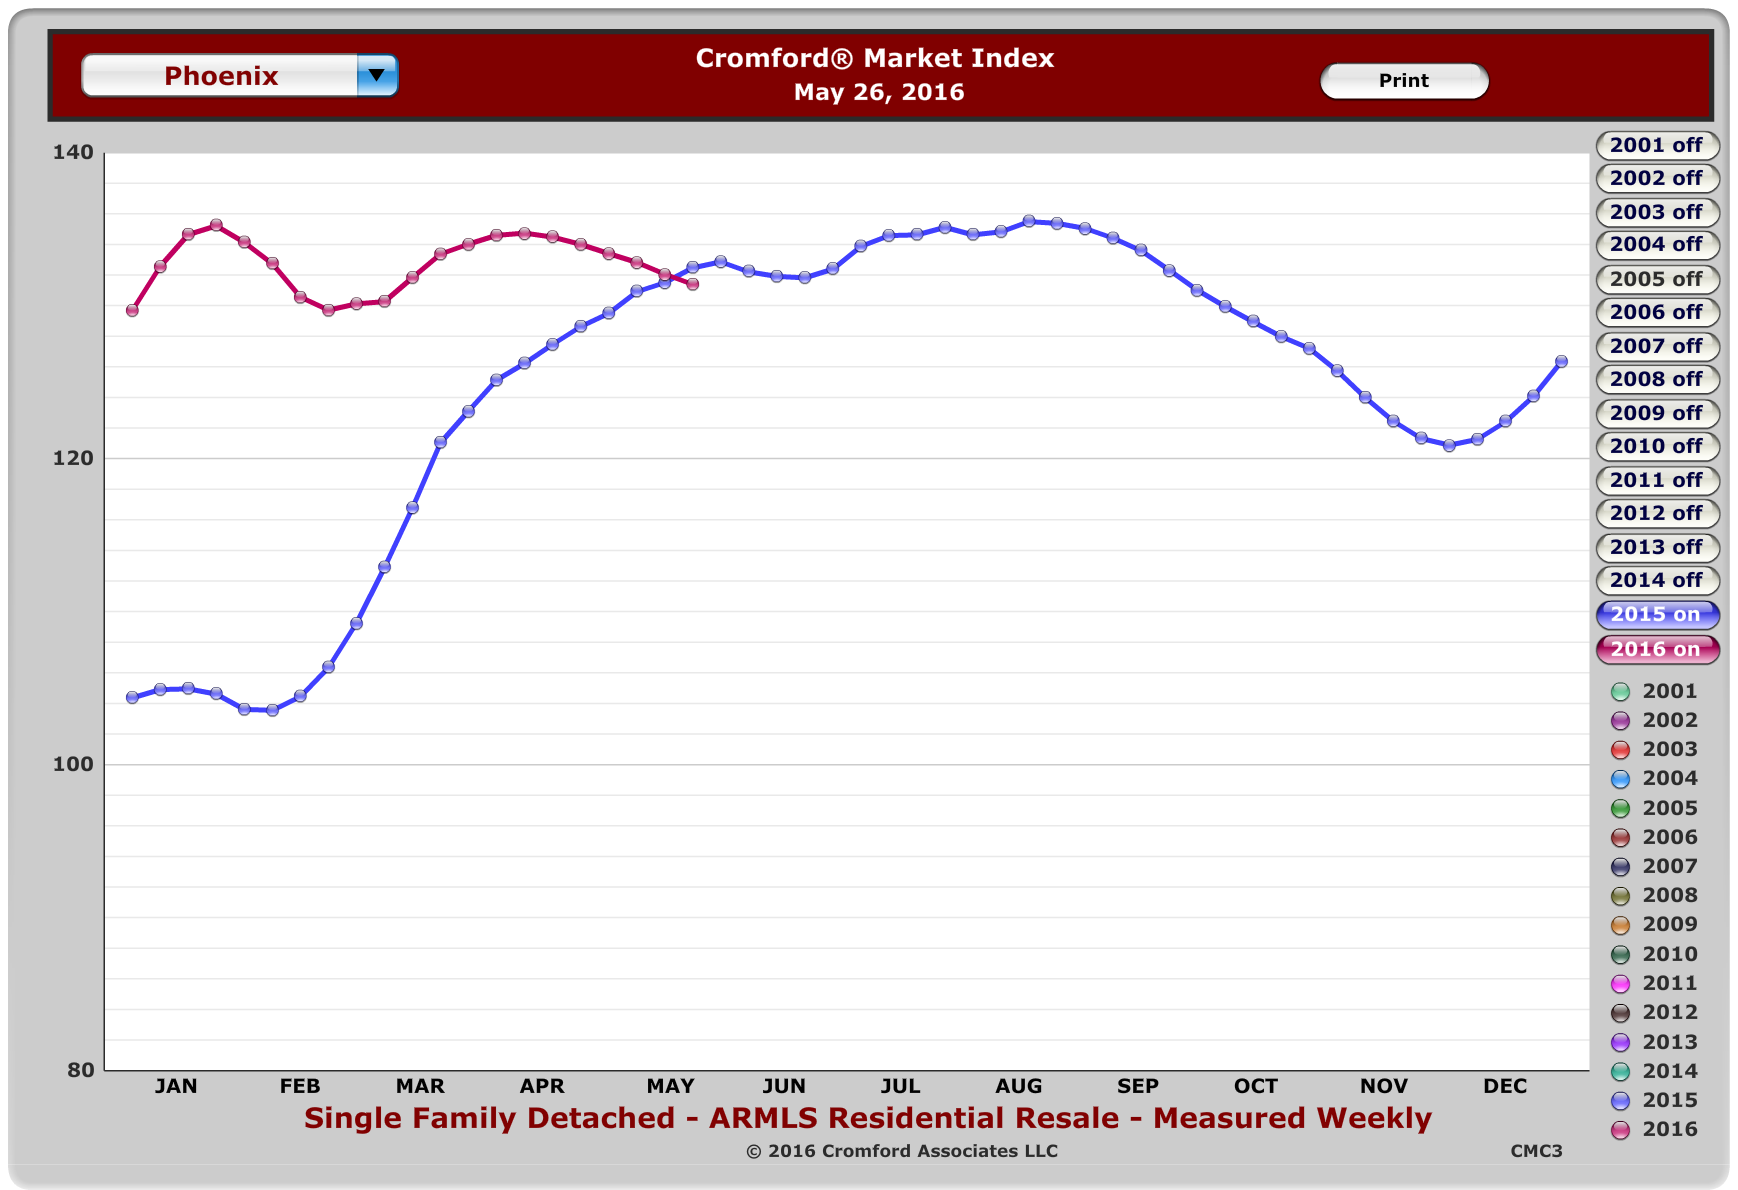
So, what does that “retreat” actually mean to you? Does it mean that prices will fall? I don’t think so. When we look at the Cromford Index (a measure of who has the advantage, and by how much), you can see that sellers have about the same advantage as they had last year. (Anything over 100 is a sellers’ advantage.)
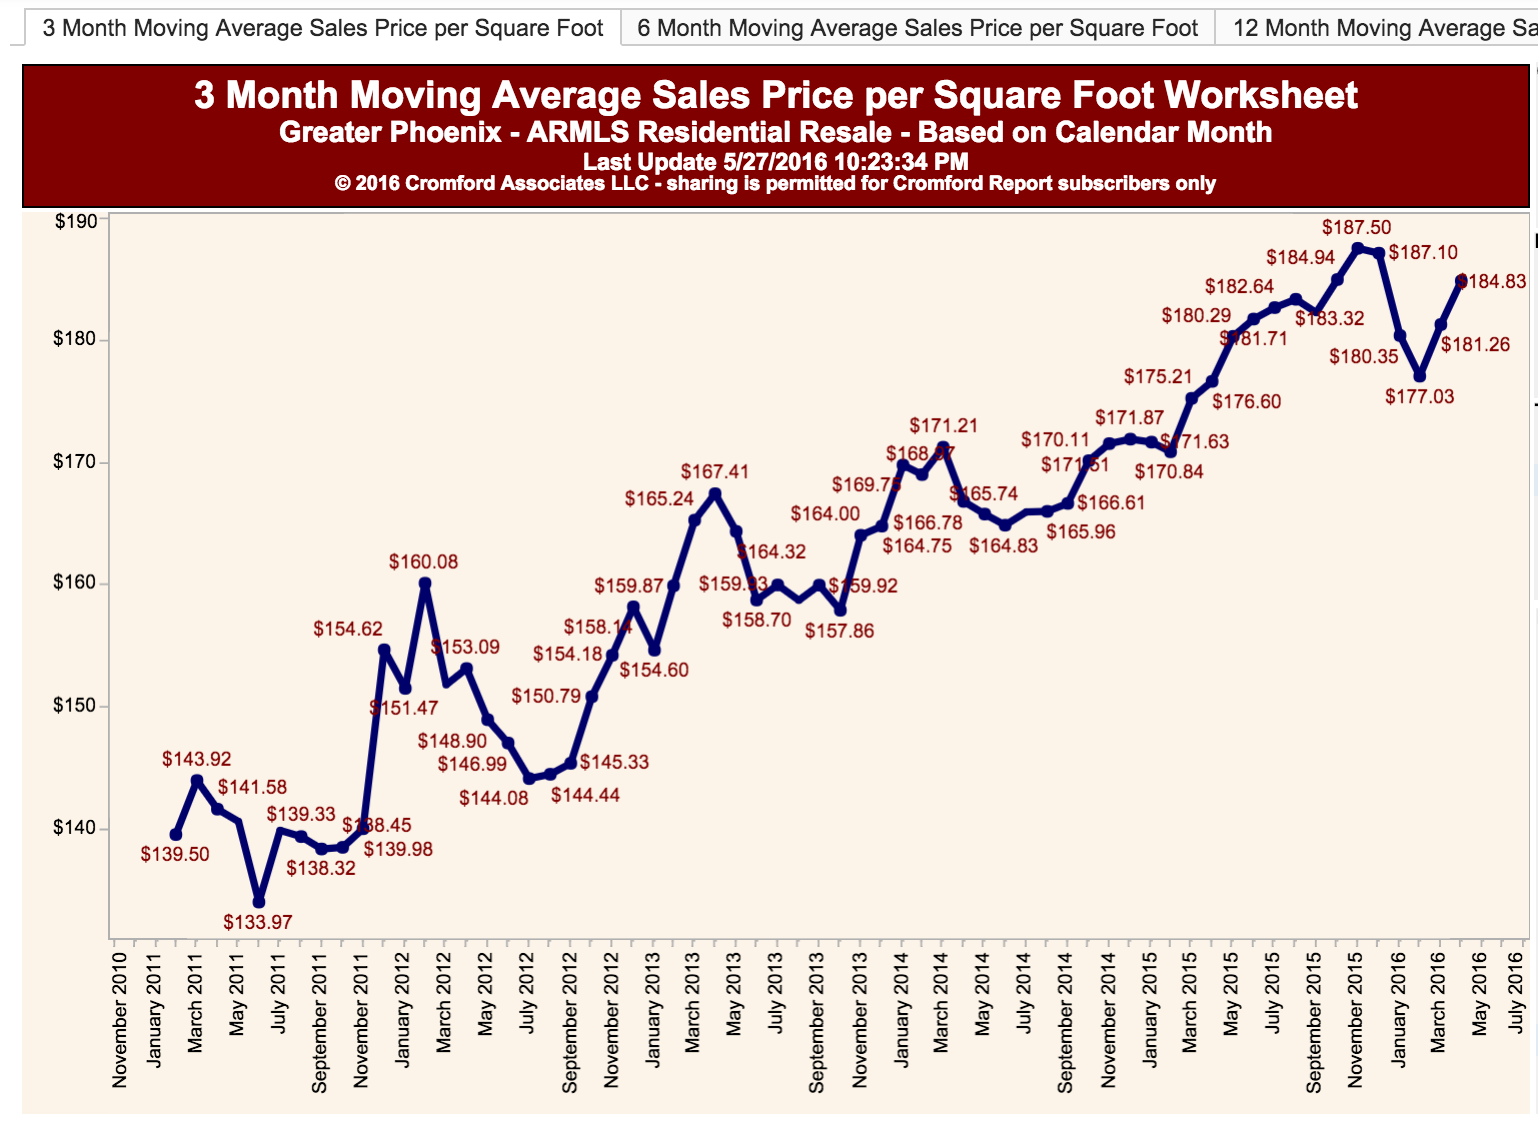
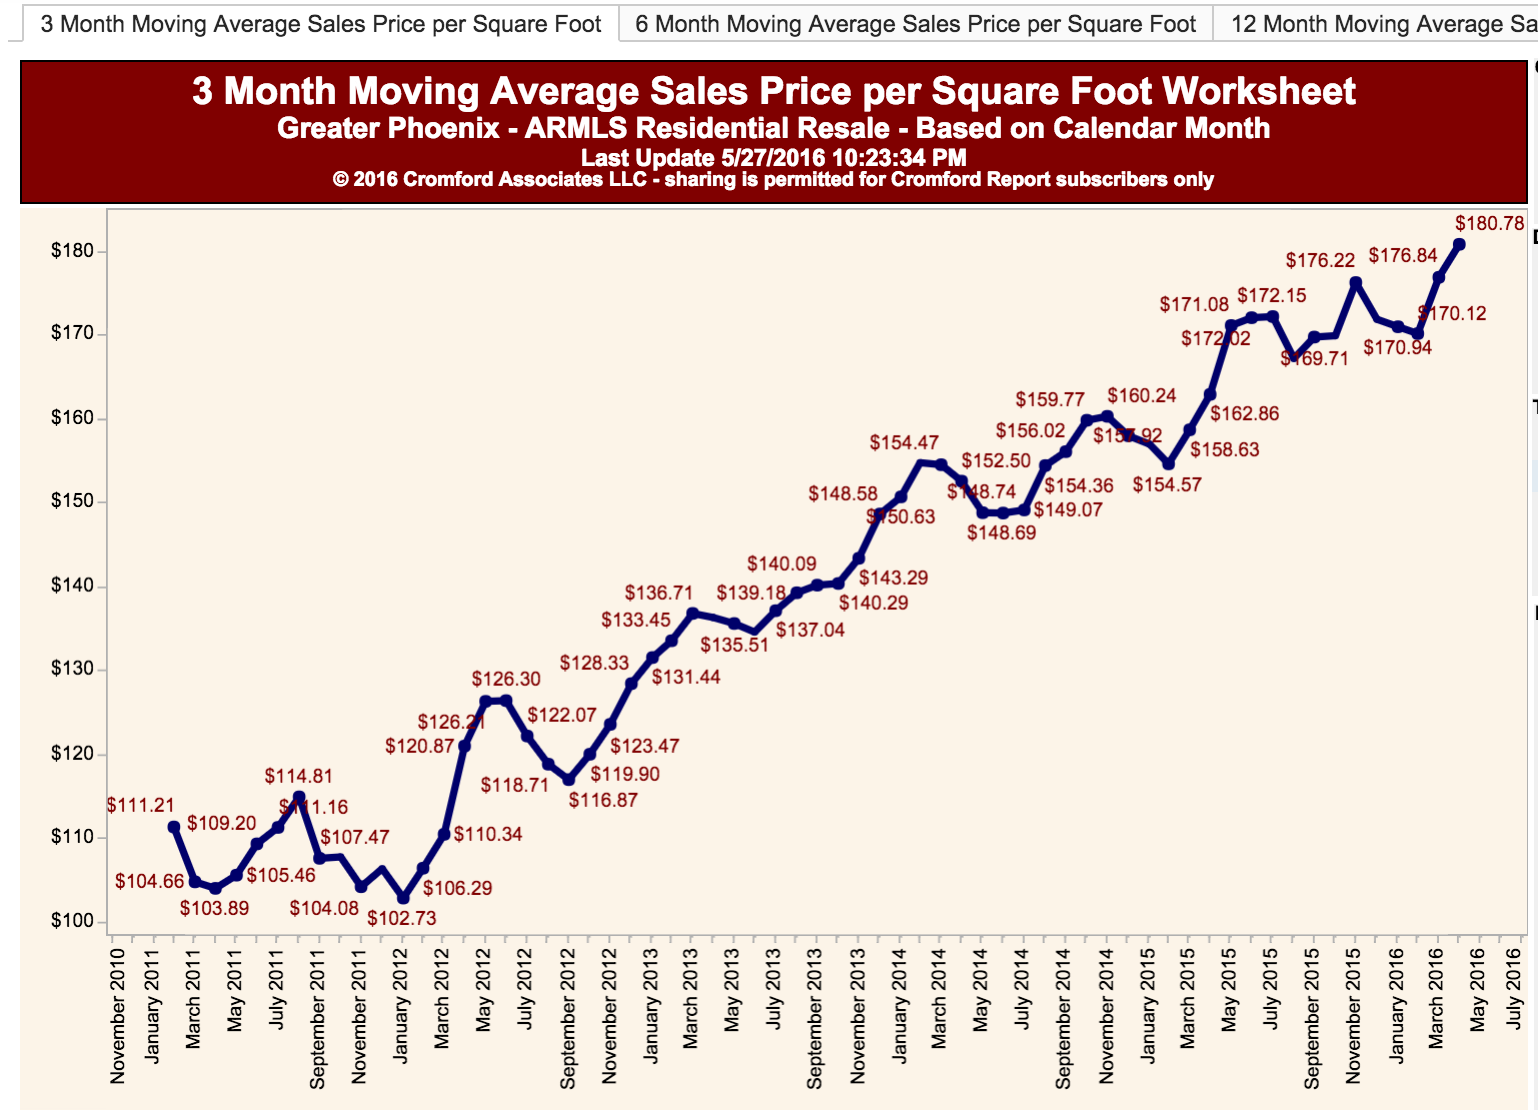
When you look at price per square foot over the last three months in the CenPho area and historic neighborhoods, you see a strong climb for all prices. But, when you break it down, you see more strength in the sub-$200k market than the $200k to $500k market.
Why? Well, probably because there are so many first time home buyers who need homes and they are just not coming on the market. I think there is also a bit of a leveling in the $200-$500k band because many of the renovators and sellers are pricing their homes too high and the buyers just are not buying it.
See below for those charts.
So, what does this mean? I think we are in for a continued strong market through the summer with prices in the lower ranges pushing upward. Michelle and I usually find that the summer still has a very strong market. Well, we are busy, at least!
If you would like to build a strategy to purchase a home or sell your home, contact us at 602-456-9388.
$200-$500k market
All prices
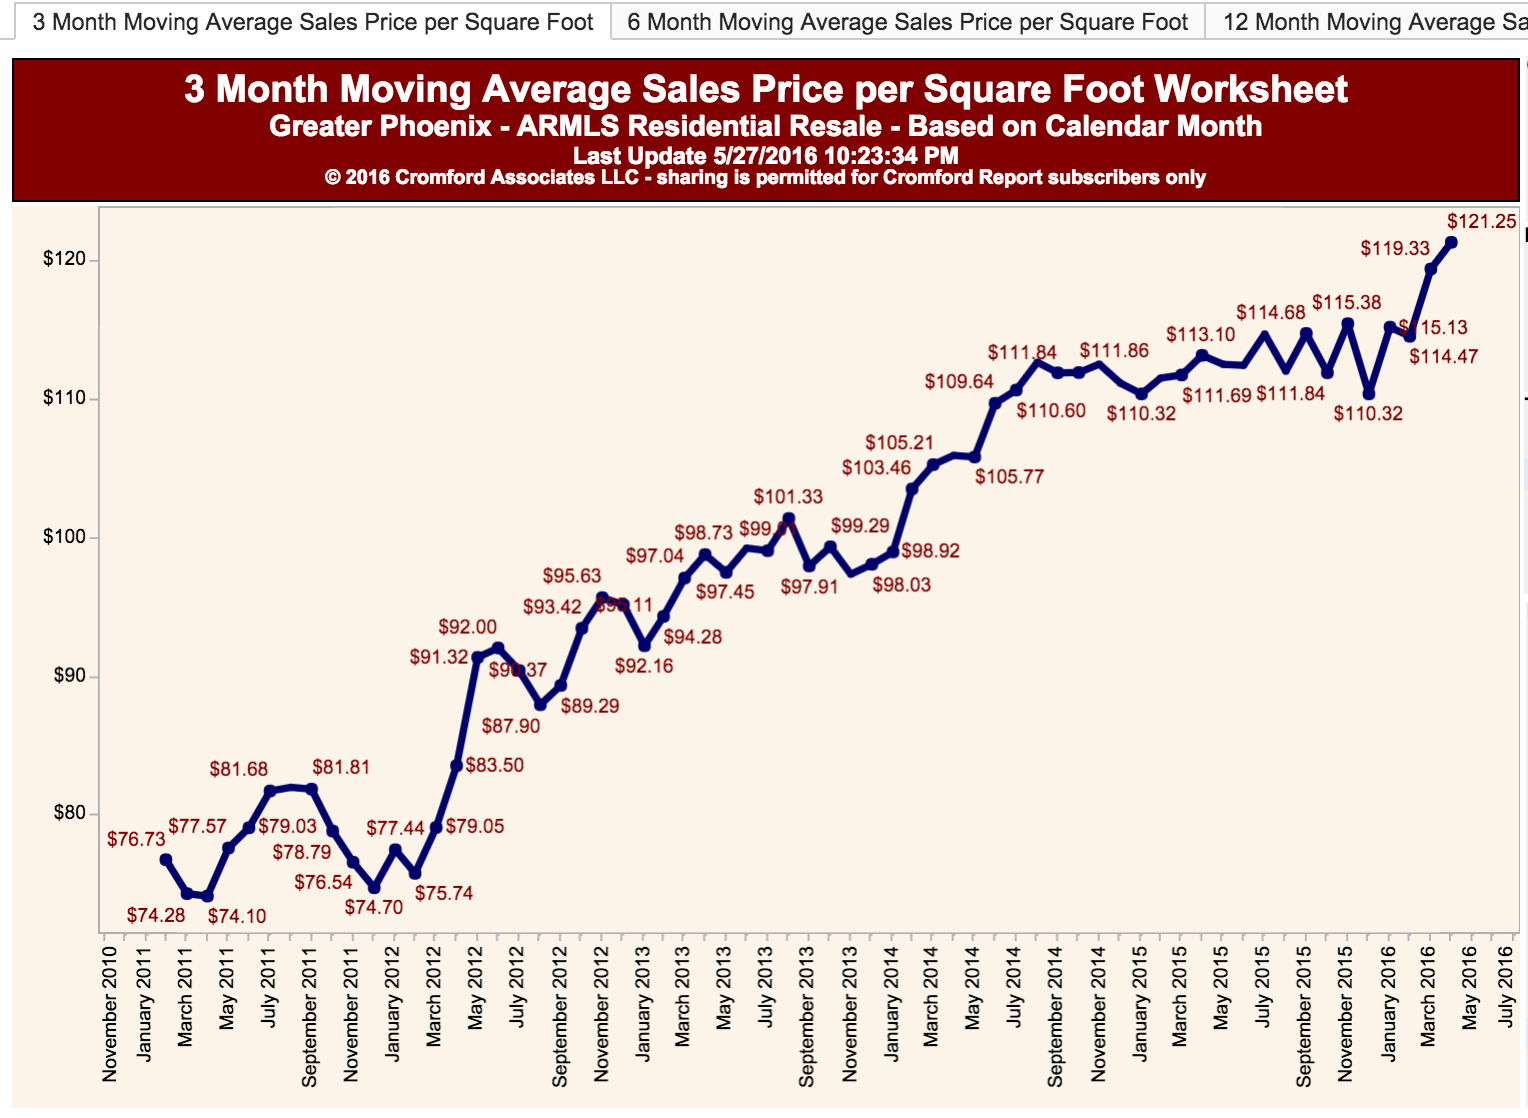
Sub-$200k market.


