
If you want a good measure of which direction the market is going, take a tip form our friends at the Cromford Report: watch how many days it takes on average for homes to sell.
From Cromford:
“April 20 – There is one “average days on market” measure that is actually quite useful but almost nobody measures. This is the average number of days on market for pending listings. We can interpret it as follows:
For all areas & types the following guidelines apply
- under 60 means a very hot market
- 60- 70 means a hot market
- 70-80 means a warm market
- 80-90 means a balanced market
- 90-110 means a cool market
- over 110 means a very cold market
The absolute number is probably less useful than the trend. When the number is falling, the market is improving and when it is rising it is deteriorating (from a sellers perspective).”
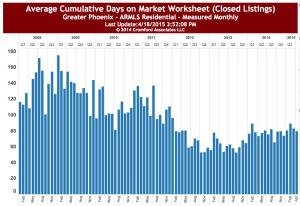
So, have a look at this chart, showing average days on market for the zip codes which house the major historic neighborhoods, plus much of central, north central and downtown corridors.
The first three months of the year show a distinct drop in days on market. The over-all condition is much lower than it was just four years ago. But, this current trend tracks with what I was seeing in my last post about the seller’s advantage we are seeing right now.
If you need help navigating what all of this means and applying it to your personal situation, please give me a call at 602-456-9388.


