A funny thing happened in July and it may affect the August market update.
Well, “funny” may not be funny for buyers.
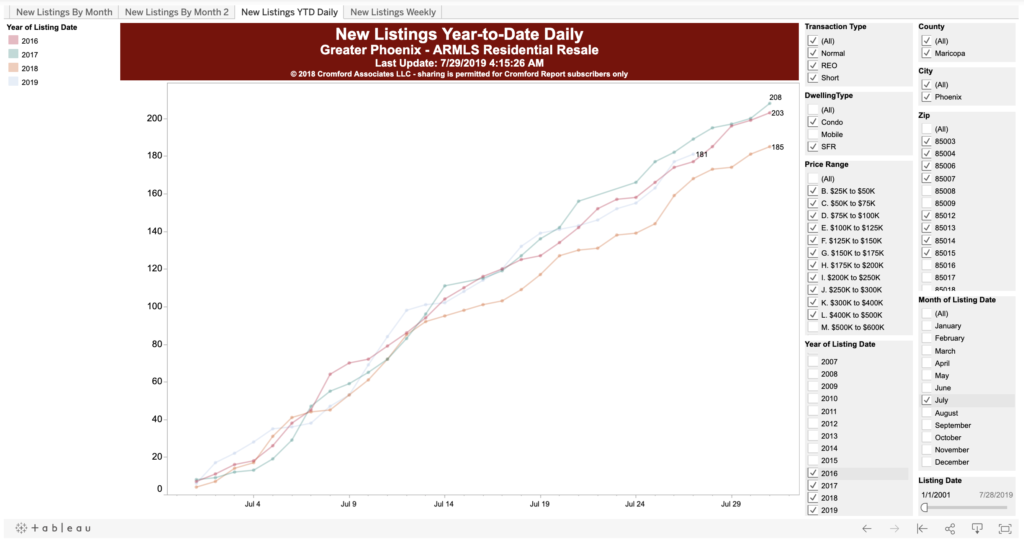
Look at this chart of new listings that come on every day in July, compared over several years.
It’s hard to see, but there is a light blue line at the bottom of the grouping of lines, with the number 6,119. That represents the number of new listings in Maricopa county that came on in July.
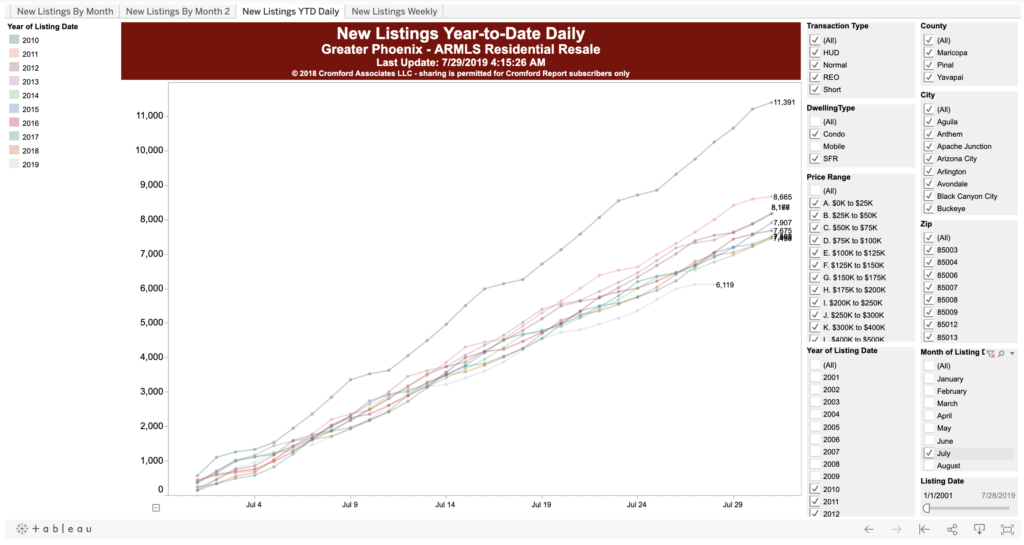
Notice that the July 2019 number is at least 1,000 listings lower than the next closest line. So, we have had fewer listings coming on the market this July than any July since 2010.
I also turned on all years available in the system and it is the lowest July since 2001 –and there were fewer houses in the valley back then.
Now, when you look at just listings above $500,000, that difference disappears. But it is strong for homes under $500,000.
What does that mean? Should we be alarmed?
Well, we don’t know yet. (Sorry to those of you who like certainty. You won’t get it on this one.)
It could be a blip. This trend started in June and it could disappear in August. We need to watch it.
If it continues, then those of you who are thinking of listing your home should go ahead and list (especially those at or below $500,000). There is scarcity in the market in that case and it gives you an advantage. Further, people need homes, so they will be looking.
If you are a buyer, be patient, as it may take you a while to find what you need. Also, be ready to go see a house and write an offer immediately if you like the home.
There is still a scarcity in the market and this just happens.
NOTE! This dynamic does not seem to be happening in the CenPho historic zip codes. See the chart below. So, for these zip codes, the July listing numbers seem to be right in line with previous months.
So, if you need to build a strategy around selling or buying, please call us at 602-456-9388.





 whether the sellers had to offer concessions, etc.