August Shortage Update
The August Shortage Update is showing things getting a little better. Not a lot better. More like “better” in how the new Suicide Squad sequel will certainly be better than the first soggy rag of a movie that the first one was.
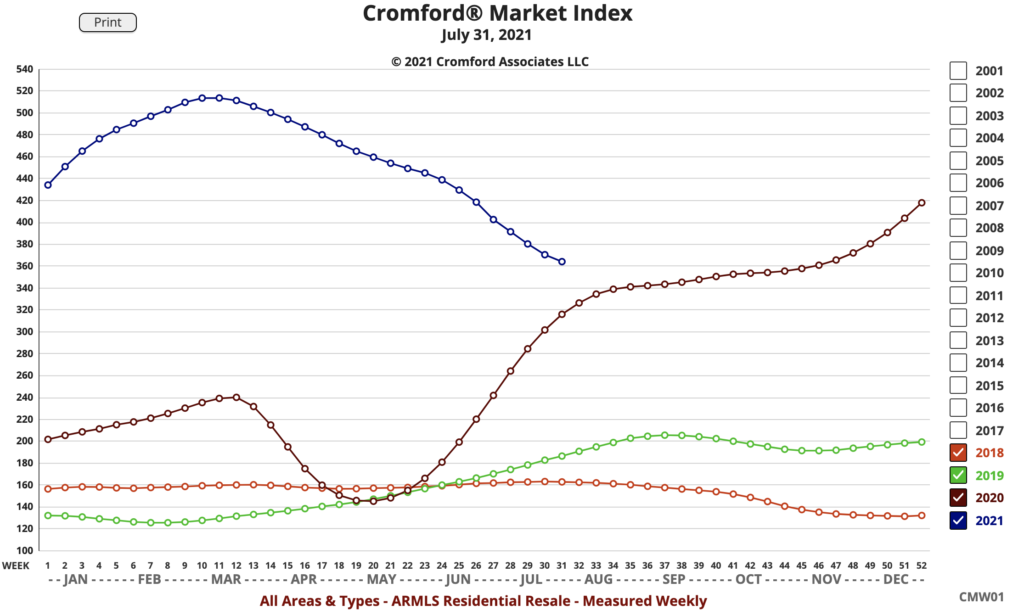
To put that in real estate terms, watch how the Cromford Index is dropping right now. That’s an indication that the sellers’ advantage is shifting.
Cromford Report eggheads, take it from there…
“Here are the basics – the ARMLS numbers for August 1, 2021 compared with August 1, 2020 for all areas & types:
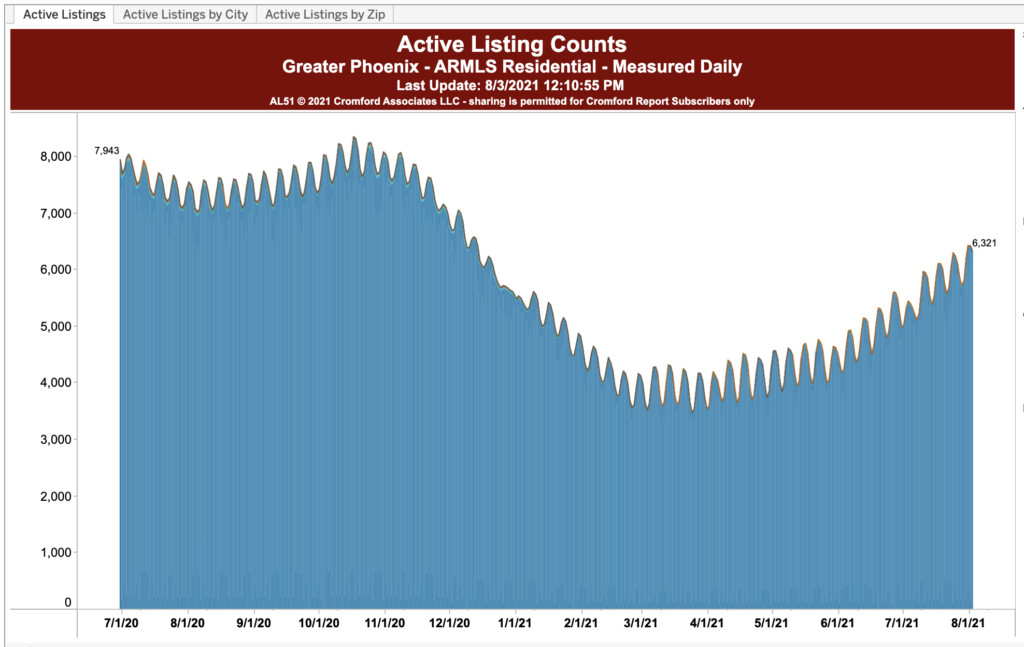
- Active Listings (excluding UCB & CCBS): 7,105 versus 8,477 last year – down 16.2% – but up 24.7% from 5,699 last month
- Monthly Average Sales Price per Sq. Ft.: $250.93 versus $191.21 last year – up 31.2% – but down 0.5% from $252.15 last month
- Monthly Median Sales Price: $400,000 versus $315,000 last year – up 27.0% – and up 0.8% from $397,000 last month
Supply continues to move higher. We would usually consider a 24.7% increase in one month to be an exceptional growth rate. However, we are rising from a very low point and the number of active listings without a contract is still down 75% from what would be considered normal. We are witnessing new listings arrive at a faster rate than we usually see at this time of year, especially those priced between $400,000 and $1 million. This is helping buyers, but there are still far more buyers than homes for sale.”
My “normal person language” interjection here for the August Shortage report: If you have been thinking of selling, do it now before a bunch of houses come on later this year to compete with you.
To continue with our Cromford Analysis…
“I still read articles describing demand as exceptionally strong. This is absurd. Demand is only slightly above normal and has been getting weaker over the last several months. This is obvious both from the pending and under contract counts (down compared with last month and last year). and from the monthly sales counts (down compared with last month and last year). If demand were strong, then all these numbers should be responding to the increase in supply. They are not.
The large majority of market commentators have not grasped that demand is not the issue. Interest rates are not the issue either. Everything today is about supply. Even after a rise of almost 25% there is nowhere near enough supply to take the stress out of the market.
Demand has changed its make-up since the start of the year. Owner-occupiers are down, while second-home buyers are up, particularly those from out-of-state. Also more active are iBuyers and all types of investors, with fix and flip and buy-to-rent investors filling the gap left by owner occupiers. Many buy-to-rent operators are buying from each other, and a few are building neighborhoods entirely for rent. This practice started in Phoenix in 2012 and the original local company that built the first rental neighborhood in Gilbert has just sold it complete to one of the large institutions. The build-to-rent business does not affect our numbers since the entire neighborhood is owned by a single company and the homes are never listed for sale. It is similar to the multi-family apartment block market. The only difference is that the homes are physically more separated from one another, an attractive benefit during a pandemic.”
Gonna interject here again with my August Shortage Update perspective and tell you, “I’ve been saying this for a while. The combination of rental buying companies, individual rental investors and short-term rental buyers have crowded out regular buyers and have driven prices up. Not sure how this ends.”
Cromford continues…
“Over the last year, prices have not been rising because of strong demand or low interest rate, as often stated by the media. They have been rising because of extremely poor supply. Buyers do not pay more for a home because they can. They pay more because they have to. Multiple bids make them pay more, unless they drop out. Low interest rates merely allow them to compete. If there were more homes for sale, they would get the home for less than the asking price. During July the average buyer had to pay 1.4% over the asking price.
New home builders currently experience elevated demand because so many buyers have given up on trying to find a re-sale property. But the demand they perceive is due to the low supply of re-sale homes, not some unusual build up of buyer demand. The new and re-sale markets are not really separate because almost every buyer can switch from one to the other based on personal decisions. Buyers are spilling over to the new home market that would normally have chosen a resale home.
The market remains hot but has been cooling for 4 months now and this is reflected in a large array of measurements. For example:
- In June, buyers were paying 1.8% more than list price on average, well above the current 1.4%
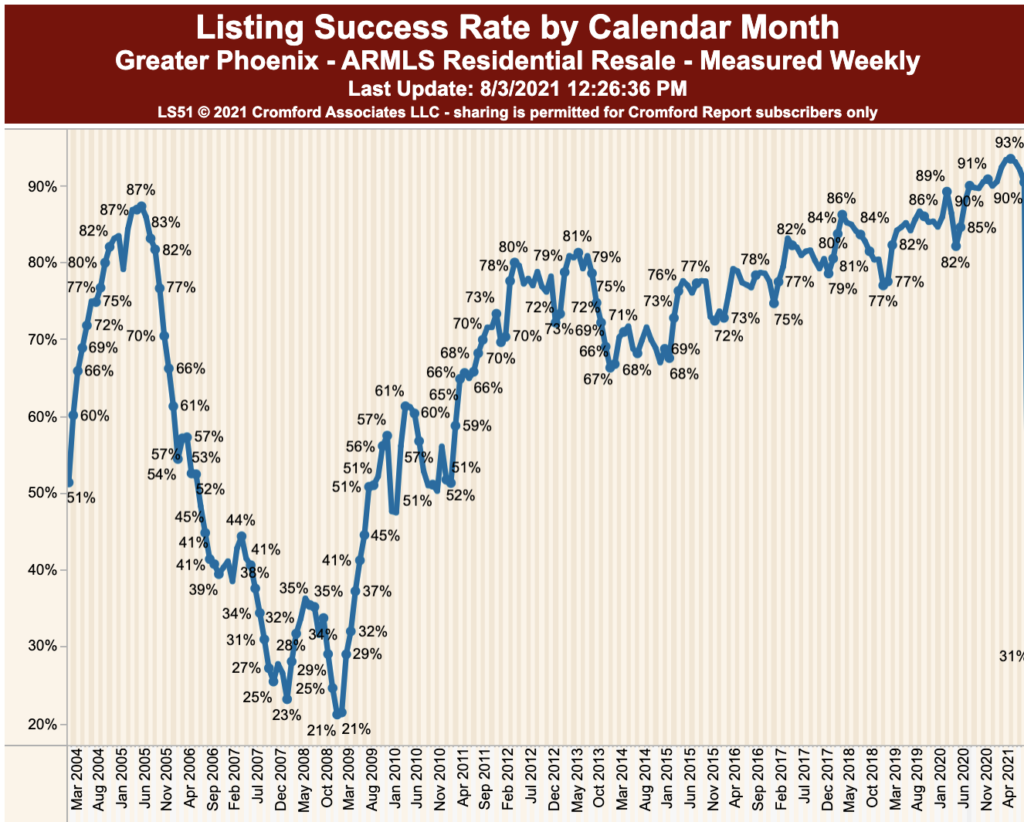
- The listing success rate is down to 89.3%, having peaked at 93.1% in May
- The contract ratio is down to 155, having reached 332 in March
Prices have been leveling off over the past month. This is consistent with the seasonal trend that weakens prices during the third quarter in most years. It is caused a by a slowdown in high end sales during the hottest months (May through September) We did not see that effect last year because of the lock-down, but this year we expect 3Q to be nothing like the explosive 2Q. There is still no long-term downward pressure on prices and this pressure is unlikely to emerge until supply rises much higher than current levels.”
I know this August Shortage Update has been a lot longer than I usually write these. But there is a lot of nuance that the regular media is missing.
Give us a call at 602-456-9388 if you are making plans to buy or sell. We can help build the best strategy.


