Get Your PHX - A Whole New Way to Experience Phoenix
  • Home
  • Our Blog
  • About Us
  • Contact
Get Your PHX - A Whole New Way to Experience Phoenix
Home
Our Blog
About Us
Contact
  • Home
  • Our Blog
  • About Us
  • Contact
Homes, Live, Market Analysis

Analysis Refresher: The Cromford Report

Last week, I noted that we are in a buyer’s market. I know this because of the The Cromford Report –outstanding data analysis group here in Phoenix. They’re kind of like the Case-Schiller Index –except for Maricopa County, and, you know, ACCURATE!

Today, I want to give a little refresher for those who may not be familiar with The Cromford Report and explain this index, which is specific for The Cromford Report. The Cromford Report was started by Michael Orr, who’s a mathematician from Oxford, and the director for Real Estate, Theory and Practice at ASU.

This index is an algorithm that Orr put together to let us know whether or not we are in a seller’s market or a buyer’s market compared to the last balanced market, which was in 2001-2002.

This slide shows that we are in a buyer’s market.


Anytime this yellow indicator is above 100, it’s a seller’s market or a seller’s advantage, where demand is outstripping supply. When it’s below 100, it’s a buyer’s market.

That means there are more properties than buyers out there to absorb them. When we’re right in this little yellow area, that’s what we consider balance.

The reason why this indicator is important is it’s the very first thing to move when there’s a shift. The very last thing to respond is sale price. So when this moves, you get about a three month advance notice of a shift in price.

See in 2005-2006 how that index dropped dramatically below that yellow line  –that was LONG BEFORE we saw prices start to drop. See the image below, for an example of that lag in prices and perception.

As long as this is above 100, pressure is on prices to go up. As long as it is below 100, pressure is on prices to go down. When it’s at balance, prices will stabilize.

When this indicator shifted, you had one to six months to get out of your property while the prices were still going up. When prices are trailing the indicator, it’s lagging. Once it crossed over the yellow line, it took six more months for our prices to peak.

So in Phoenix, our prices, our raw sale price, didn’t peak until 2006. We actually a year and a half advance notice.

That’s the power of The Cromford Report.

Next week: You’ve probably seen all of the price appreciation and all the fun that comes along with seller’s market all within the last two and a half years, but this shift is significant because it’s not a crash. That line dropping below the yellow line in 2005. That’s a crash. Where we are right now, is not a crash. It’s an adjustment to the market, and we might see this bounce around this line a little bit as we find our new normal. But next week, I’m going to show with the evidence in The Cromford Report where we are and why.

If you are buying or selling you need to pay attention to see where things will go. Got questions? Give me a call me at 602-456-9388.


February 17, 2014by phxAdmin
Phoenix News

FREE Law Services to Quailfying Phoenix Businesses

How can you get FREE law services for your established Phoenix business if you’re unable to afford it?

The Delgado Law Group, PLC was just awarded—for the 3rd time—the Community Development Block Grant (CDBG) from the City of Phoenix (yep, just like in a previous post when we noted that an architectural firm won the grant for their free architectural services),if you’re within the City of Phoenix you just might qualify as one of a few firms to get their law services for free.

“The CDBG grant allows my firm to provide entrepreneurs and small businesses located in Phoenix with business legal services, including but not limited to, business formation and planning, contract drafting and compliance, commercial real estate, trademarks, employer/employee relations, and other legal services relating to day to day business operations.” ~ Jennifer Delgado

Why was the Delgado Law Group selected for this grant?

In 2009 and 2011 they were also awarded the grant to provide legal services to low/moderate income business owners through the City’s Community Development Block Grant (CDBG) program. Because of how well the Delgado Law Group provided their clients in the program with individual attention, integrity, efficiency and commitment, the City then awarded Jennifer’s firm with the Economic Development Award of Excellence in 2011.

How can you take advantage of the CDBG Grant and put these community-driven lawyers at Delgado Law Group to work for you?

Follow these steps:

  1. Contact the Delgado Law Group at (602) 821 – 7461 or reach Jennifer Delgado directly – jrd@delgadolawgroup.com
  2. Give them your business address and/or household income stated on last year’s tax returns and they’ll see if you’re a qualified participant.
  3. Note that you must intend to hire people and that the program is not available for non-profits or churches. However, the program is flexible and is sincerely looking for people who really need the help.
  4. Delgado Law Group will give you a CDBG application.
  5. Fill it out and they’ll make a determination of whether your business qualifies.
  6. If approved, Delgado Law Group will provide all legal services and associated costs free of charge.

The principal of Delgado Law Group, Jennifer Delgado, received her undergraduate degree with honors from the University of Massachusetts at Amherst in 1996, and her law degree from Boston College Law School in 2000. She is a member of both the Business Law and Real Property Law sections of the Arizona State Bar and is licensed to practice before the Arizona Supreme Court, the U.S. District Court for the District of Arizona and the U.S. Court of Appeals for the Ninth Circuit. Ms. Delgado sits on the Board of Directors of Roosevelt Row Community Development Corporation and is a past president of the organization.  The firm is also a charter member of Local First Arizona, a non-profit organization dedicated to promoting independently owned local businesses in Arizona.

If you want to buy or sell a home, be ye a Lawyer yay or nay, please give me a call at 602-456-9388 or email me at ken@getyourphx.com.

August 21, 2013by phxAdmin
First Time Home Buyer, Market Analysis, Tips

Town Criers: From Whence do They Come? (Analysis – part 5)

Are they just uninformed people? Those who declare “The Bubble is coming! The Bubble is coming!”? We know we’re not in a bubble, based on the first four parts of this series, but where do the voices of doom come from?

I’ll tell you something: earlier this year, before I sat down and took a good hard look at the facts and figures, before I started laying the foundation for my market analysis briefing (upon which this series is based), before I did all, I’ve got a tell you I was worried that we were getting into minor-bubble land.

But Get Your PHX/Cromford Report team mate Tina Tamboer talked me off that ledge.

People are seeing agents listing properties at irrationally high prices. This doesn’t necessarily mean we are in a bubble. What it means is: agents are listing properties at irrationally high prices just because their clients want them to go fishing for a higher price.

Their buyers are telling them, “I want you to list it here, at this amount.”
Their agents may tell them, “Uh, that’s a little high for the comps.”
And the seller says, “No. I want to list it here.”

Agents advise, but can ultimately only do what they’re told. If a client wants to list it high, you list it high. Other people see that pricing, then they try to list it high, etc.

Remember I said in the summer things slowdown in terms of sales?

I’ve indicated in green lines, below, the first and second quarters between 2001 and 2013. Right now, we’re just hanging out close to our long-term average.

Which means what, exactly?

This year, watch for prices to go up for the first two quarters [like they always do]. People will be listing furiously. You still are not going to see the number of listings you saw during the bubble. When you get into the summer, at the beginning of that third-quarter, and all the way through the third quarter, you’re not going to see a slump, but a plateau.  ~ Tina Tamboer, Get Your Phx/Cromford Report

People go on vacation and fewer people list. Glance back to all those sections with the green lines. Note that regardless of the severity or abundance of sales, Q1 and Q2 sales always increase, followed by a plateau. So here’s the take away: if you are thinking of listing, it is better to list it and sell in the first two quarters.

Right now, we’re just at the beginning of the second quarter. You still have just shy of three full months. If you put a property on right now, chances are – unless you’re priced way above market – you’re going to get your house sold in a matter of weeks. If it’s a nice, clean property in central Phoenix and most parts of town, you’re going to sell pretty quickly.

Once you get to the summer, you might see activity slowdown, and prices fall back a little bit.

Do you really want to risk that?

When you get into the end of the year, what happens? Look back up to the chart again at Q4 over the years. You’ll see that end of the year home selling is not as good as beginning of the year. Why? Because in October, November and December, people are beginning to think about holidays, which is why sales slowdown at the end of the year. The conclusion is the same: the best time of the year to sell your home is in the first two quarters.

The first quarter of 2013 ended a week ago. You’ve got less than one quarter left.
If you’re thinking of getting your home out there, talk to me.
We’ll get it out there.

Please give me a call at 602-456-9388 or email me at ken@getyourphx.com

[megaphone man: Shrieking Tree ]

May 8, 2013by phxAdmin
First Time Home Buyer, Market Analysis, Tips

Return of the Equity Seller (Analysis, part 2)

In Part 1 of my “Riding the Rollercoaster” post from last week, I hope I made it clear what a normal market looks like, why it’s  important to remember that the market is a function of supply and demand, and why price is a trailing factor running two months behind the market.

A person’s natural question when they learn these things is “Oh, is this another bubble?”

Now, we’re going to show you why we don’t think it’s a bubble.

We think we are  normalizing.

Don’t Burst My Bubble

Here’s evidence that we’re not in a bubble. Below is a graph of distressed sales in percentages for Maricopa County.

  • The grey background is all the sales from the Multi Listing Sales Data.
  • “Lender owned” is in red. See how from 2010 through 2012 it’s going down, down, down. This red line is a percentage of sales, relative to the orange and green lines. Add up each point on a different colored line and you get 100% of sales.
  • “Short sale” is in orange. See how it’s been fluttering pretty steadily up and down since 2001 and then in Dec 2012, it drops, drops?
  • “HUD” in blue has always been around 3% or so since 2001. Really consistent, regardless of recession activity.
  • “Traditional Sale” is in green. Just a nice, even climb, upward.

So as two of these have been declining—Lender Owned, since 2010; Short Sales, since Mid-2012—and with HUD Sales always at regular levels, only Traditional Sales are going up.

On average, over the long term were getting back to the point where a certain percentage is always going to be foreclosures. Before this pre-recession bubble, nobody knew what a short sale was. Agents didn’t know what to do with them; they didn’t even know how to process them. The vast majority of agents never had to deal with them before.

Appreciation by Transaction Type

This next chart shows the monthly average sales price per square foot. At the far left of the blue line is December 2009 when we were at $123.70 per square foot. So even though we have more properties coming on the market, which we know from the previous chart and its evidence of increasing Traditional Sales,

It’s not like you’re seeing this radical push up in price, says Tina Tamboer-Glatfelter (Get Your PHX Team/Cromford Report)

What Tina means by this is that you have more things on the market that are normal. If this were a bubble you’d look at all the properties and you’d see them all go up in price. Here, you’re seeing more come on the market, but they’re still not up in price. They’re at the same price per square foot.

Maricopa County Median Home Sales Prices

The faint blue dashed line is the long-term trend line. Back in January 2001, at the far left, the median home sales price for Maricopa County was $139,500. The dashed long-term trend line continues upward to the right. If we had a forever normal market, you’ll always see this nice long slide upward. At my last market analysis gathering on March 21, Tina showed us what happened in the bubble and why.

Look at the spike up on the left of the Matterhorn shape. Why did it go up like this? You had 100% financing, people were getting cash back from their mortgages, and you have all these schemes.

And then there was that one day when somebody couldn’t sell their house for more than they thought they would. And then their neighbor, who had all this extra money taken out of their house, suddenly found that their house wasn’t worth anything, and then there was Wall Street, which didn’t help, and then it all started to tumble apart.

So now track your eyes at the tipping point of that mountain to the right, where in 2007 you had foreclosures, people couldn’t sell houses, nobody could get financing to buy up the houses that were sitting there, and you had unemployment. So that’s when we hit that lowest, lowest point in January 2009. The lift in the line between the bottom of January 2009 and that first little peak is when people were trying to get that first time home buyer’s tax credit. Then it dropped again. That’s the best effect we could do with that tax credit.

Then the lowest median sales price that we had was $123,150 in March 2011. Right now, April 2013, we’re at $180,000. You can see that on the far right of the graph. See how we’ve had a 23% increase in the median home sale prices since March 2011?

The Skinny.

If we were in pace with that long-term dashed trend line of a normally rising market, we’d be at the $200,000 mark. But because we’re at the $180,000 mark, this means that we still have some time here. The point is that we’re still $20,000 under a normal median sales price.

We’re not at a bubble yet.

But the real kicker is this:  …and I’m going to show you that very thing next week.

In the meantime, if you want to sell or buy, please give me a call  (602) 456-9388 or find me at ken@getyourphx.com

April 19, 2013by phxAdmin
First Time Home Buyer, Market Analysis, Phoenix News, Tips

Market Analysis: Riding the Rollercoaster (part 1)

The market price is a function of supply and demand.
~ Tina Tamboer-Glatfelter, Cromford Report


“oh, oh! It’s going up! It’s going up!”


”Oh, no! Now it’s going down, it’s going down!”


It sounds simple, but people get sucked up in the passions of the moment. They forget that price is a function of supply and demand.

100 is the magic line on the Cromford Supply Index.  As you can see from the graph, below, we are below the horizontal supply line of 100. It’s gone down, down, down, so today, in 2013, we are right about where we were in 2004. 

On the Cromford Demand side, we are higher than on normal demand—people have been talking about the high demand, but look, the demand was much higher in 2009.

Tina’s point is not that the demand is super high and therefore that’s what’s making this happen.  It’s that the supply is super low. So, yes, the demand is above average, but it’s not at 150!

Like Transformers.

The Supply Index and The Demand Index transform to show us when there is a seller’s market or a buyer’s market.

In Tina’s presentation at the Get Your PHX March 26 Market Briefing, she showed how the market index was at 300 market index before the recession, which is when many people bought their homes. See how the market index comes up a little bit in 2009?

This is where it becomes a seller’s market for just a short amount of time because people needed to use that first time home buyer’s tax credit. Then that went away and it dropped. Now we’ve been climbing up, steadily.

One of the most common questions Realtors hear is ‘When is the best time to sell my property?’  Often a seller wants to sell at the peak of price, when they can get the most for their investment.  However, their answer should be to sell during a seller’s market, when there’s more demand than supply.  Price is a trailing indicator, meaning that it’s in response to leading indicators such as supply and demand.  By the time our market peaks in price, and the media reports on it months later, the seller on the fence is too late to the party.

The Cromford Market Index is a tool that combines supply and demand data for the Phoenix Metro area to give clients a bird’s eye view of whether we’re in a seller’s or buyer’s market.  From this chart we can see that the peak of the seller’s market was Spring of 2005, after that the index took a dive and seller’s only had 7 months of advantage before reaching balance.  Prices, however, continued to rise until peaking from 2006-2007 when buyer’s took solid control of the market.

Today we find ourselves in a seller’s market once again and consumers are wondering if it’s a good time to sell.  Currently the answer is yes, but if supply increases or demand decreases you don’t want to get stuck on the fence.

~ Tina Tamboer-Glatfelter, Get Your PHX Team/Cromford Report

What’s a normal market?

Most people do not know what a normal market looks like.

For the last 10 years, we’ve been in either a severe up-swing, or crash, or coming out of it. In a more normal market, though, you’re going to fluctuate back and forth on this range among either side of this 100 line of the seller’s market/buyer’s market index line. So what’s happening is you get people reacting more extremely than they would in a normal market. Have a look again at those green circles again, below.

Low and behold, here we are, today, right back where we were in 2004.

If you bought in 2004, you’re probably in a good place to sell it. If you bought in 2009, 2010, 2011, you’re probably also in a good place to sell it. This is important to emphasize.  You’re starting to see people put things on the market, which is good, because it’s a seller’s market.

When you factor in what we’re seeing in terms of distressed and non-distressed single family inventory, foreclosures, and short-sales, and then look at it all in context, you’ll understand why equity seller is returning. That’s next week.

If you want to sell (or buy), please give me a call at 602-456-9388 or email me at ken@getyourphx.com.

[rollercoaster pic: Upsilon Andromedae]

April 11, 2013by phxAdmin
First Time Home Buyer, Tips

Credit Unions: The Deciding Factors (5-6 of 6)

In part four, we discussed the different local credit unions and how their Health Savings Accounts work. Now, we’ll discuss how to select the best credit union based on brokerage account services.

A brokerage account is like a money market account, but from it you can buy stocks, sell stocks or buy mutual funds.So it’s like a health savings account except the money is for investment or portfolio items. Like an HSA, there’s a firewall. The reason – credit and the bank should remain separate.

For example, if you are on your  JPWellsComeriBank account online and want to look at your brokerage account, the website will open a new window and take you to that separate brokerage website. With Desert Schools Credit Union, they will personally connect you with a financial services company who will set up your account services, etc. You can set up your account on Desert Schools to make automatic bill pays to your brokerage account, as well. Though you still must login to the brokerage accounts from a different website than your Desert Schools website. The two businesses are separate, but they are more integrated on a personal level.

[image: Tharrin}

When I called Desert Schools Credit Union, I was directed to financial services, and spoke with a representative immediately. He told me about what they had, that he’d look at my portfolio, and help me get the changes set up from my national bank. Now, when I did this over at Arizona Federal Credit Union, they directed me to a woman named Stephanie. I left my number for her, but she never called.

From the perspective of a small business owner, credit unions are all  basically the same. They have the same fee structure and basically the same offerings. The thing that really differentiates one credit union from another one is customer service. If I own a business, I want my banker to be on the phone and someone who knows me. Why am I leaving JPWellsComeriBank? Because they’re a big anonymous bank. While the fee structure among different credit unions are nice, as well as the integration of health savings account, they’re not critical. The bottom line for me: What was their customer service like?

In wrapping up this series on credit unions, we’ve taken a close look at the difference, we’ve examinatined them in person, we’ve compared the pros and cons. I can sum up the most satisfying part of this process in one example which really captures the essesnce of why I left a big national bank for a local credit union.

The story goes like this:

I went into Wells Fargo to take out my money for the last time and the woman assisting me asked, “Why are you leaving us?”

“Two reasons:” I told her. “I’ve waited too long to put my money where my mouth is and I’m finally going to support a locally owned bank. When I use my money at locally owned businesses, 30% of my money stays in the local economy.”

“But Desert Schools doesn’t have very many ATMs …”

“Are you really playing the ATM card card?”, I asked her, “You know that doesn’t matter. I can just take money out from a cash advance at the grocery store.”

Her response?

“Oh, yeah, I guess so.”

So, there we have it. I thought this process would be longer and more difficult. In some ways it was, but in most ways it is really easy to mover your money to a locally-owned credit union and keep your money where your state is, so to speak.

Good hunting!


February 14, 2013by phxAdmin
Tips

Credit Unions: Desert or Arizona? (3 of 6)

Welcome to part 3 of my investigation into the wisdom and practicality of making the switch to credit unions from my current national bank at JPWellsComeriBank.

In part 2, I narrowed it down from 10 to two Credit Unions worth serious consideration:

Desert Schools Federal Credit Union and Arizona Central Credit Union.

[photo: familymwr]

I’m starting with Desert Schools Federal Credit Union, but there is a significant amount of overlapping, so you’ll want to read this first one, first, or you’ll miss out on a good portion of both reviews.

Desert Schools Federal Credit Union

They have 56 valley locations. I went to the one on Missouri and 7th Street, by the Buffalo Exchange. They were very nice. I asked if they had a demo of their online system. They did not have one. A woman at another desk said, “You can look at my account”. I was surprised that she was willing to share her personal information and resisted at first, but I saw that it works about the same as the accounts at my current national bank, though it’s not as pretty or intuitive. JPWellsComeriBank spends a lot more money on their customer website account interface.

Both Desert Schools Federal Credit Union and Arizona Central Credit Union have mobile apps, but neither of them have the app feature where you can take a picture of your check and deposit it through your phone. Now, that’s not something I need at present, but it’s worth knowing. Because as soon as they do come out with that feature, you better believe I’ll take advantage of it, especially given the small number of physical locations compared to the larger, national banks.

Bill Pay, for all of their different checking account types, except for one that is set up for kids, is always free with Desert Schools Federal Credit Union. I was impressed with that. You can also see copies of your checks for free. The national banks charge for that. This credit union also interfaces with Quicken.

This part is the most important for a small business like mine, and in fact, it was one of the reasons I hesitated moving away from the megabank I’ve been with. In the end, I’ve seen that I really had nothing to worry about. I’m sure the megabanks are happy to feed the fear that credit unions won’t be able to provide the same on-line services.

Withdrawals from non-credit union banks are free for the first four and $2 after that. But there is a workaround to those non-specific-institution charges; one that is often utilized by people, but never openly promoted (and for obvious reasons): make a cash withdrawal when making a purchase at a supermarket. This method also suggests a way around any maximum per day ATM withdrawal amount.

For security on their credit/debit cards, they use Visa Fraud Monitoring. That seems pretty good to me. The woman I spoke with at the bank said that Desert Schools Federal Credit Union has never had their information hacked or stolen.

Regarding their customer service:  when I first walked into the bank, I was greeted after a couple of minutes and the woman who assisted me was very helpful. I didn’t tell her that I was preparing to write this blog post, but she was very surprised at the number of questions I asked.

What I noticed at both of these credit unions, if you wanted to have both free checking and a minimum balance, they required you to do a certain number of credit charges. What they mean by “credit charges” is that they require a certain number of charges to be run as credit, as opposed to running them as debit. I thought that was really interesting. I had never seen that before. I later talked to a local merchant who explained that banks get a higer percentage per charge if it’s run as credit, as apposed to debit. In the end, it doesn’t really matter to me whether I sign for it as a “credit” charge or use my pin as a “debit”. The money comes out of my account the same way.

$7 dollars a month is what you pay for their personal checking account, unless you have a balance over $1500, in which case it’s free. With both credit unions, you must have a savings account (with a minimum $25 balance) along with your checking account. This is their gateway to becoming a member of the credit union. That makes sense, because then you have voting rights as a member (remember, Credit Unions are, by definition, member-based institutions). Also, both credit unions do not require automatic savings withdrawals every month, unlike the national banks all do. This is great.

In next week’s post, I’ll cover Health Savings Accounts at Desert Schools Federal Credit Union and share my experiences at Arizona Federal Credit Union. I’ll then chose one and see if you can figure out why I chose it.

To see the next installment, click here.

December 29, 2012by phxAdmin
First Time Home Buyer, Market Analysis, Tips

Get Your PHX Market Briefing, Part 1

real estate market steamI was listening to the news recently. They were siting the Case-Shiller index talking about what the average home price was in America. This always seemed absurd to me. You could tell me that the average temperature in America is 75° and that doesn’t help me plan a trip. So I got to thinking, it would be great to have a sort of one-stop shop where people could come in and talk to people like Jeannie Bolger, Mike Orr, or myself.

So this past Tuesday, that’s what I did. We had a room of about 25 people. Some were buying houses, some selling them. Some were investors, some realtors, some mortgage brokers. Some were just curious. Another reason I did this was because I just wanted my friends to have this information. I know the market. I work hard to understand the market. We’ve been fighting some of the same myths over the past three years and I wanted to clear the air.

I covered several things in my presentation:

  • The home delinquency rate in America and in Maricopa County
  • The inventory that’s currently out there
  • Some interesting trends hidden inside the data.

Much of my briefing was based on Mike Orr’s Cromford Report. (Thanks to Mike Orr and Tina Tamboer for allowing me to share their work at the presentation and here as well.) I’m a huge fan of this report. If The Cromford Report were like the Grateful Dead, I would just follow them around everywhere, like a groupie. It’s very easy to understand, has helpful visuals, and is easy tocromford report link digest. Mike is not only behind The Cromford Report, he’s also the director of the Center for Real Estate Theory and Practice at the W. P. Carey School of Business.

Orr made this great statement, which he calls the Coiled Spring Theory:

The longer it takes for prices to respond, the larger prices are going to be.

I think that’s very true in the market right now. For greater Phoenix, the local average sales price per square foot, in just the last year, has seen a 30% increase in prices. Is that going to happen again this coming year? Quite possibly. And that has a lot to do with the number of homes left on the market, and where the next ones are coming from.

Before we get to that, let’s talk about delinquency. This is when people are simply late on their loans. They may foreclose. They may short sale.

I have heard the following phrase a lot over the past year:

We don’t know what the banks are hiding.

I like Mike Orr’s response to that. He says what they’re really saying is:

We’re too lazy to check.

It’s really easy to see what’s coming downstream from the banks. You can see it in several ways. First, by looking at the number of delinquency filings at the county courts. You can see who’s getting notices that they’re late on their loan and are in danger of being foreclosed. Second, you can see it in the number of trustee sales.

When you look at these numbers (see pictured graph, below), you see that Phoenix has no shadow inventory.

Phoenix was well above the USA average in 2009 and 2010 for the number of delinquent loans or foreclosures. Today, we’re below USA average. We’re number 38.

Below is another great snapshot of where we are.

Nevada is in a world of hurt right now. But things in Arizona are not what you have been hearing in the news over the last few years. It’s just not like that anymore for us. In fact, one of the reasons we saw the two big drops in Arizona (note the AZ drop-offs in the above graph) is that title companies got really good at processing short sales and they got us through that. So in Arizona, residential foreclosures are down.

If you want to see the big picture of why there is no shadow inventory, this next chart is a great thing to look at. I was saying it in Aug, 2011 (“If I have to hear another person predict a massive “shadow inventory” I’m going to turn green, and you wouldn’t like me when I turn green…) and I said it again this past July when I wrote about Countervailing Forces (you remember the graphic: two monopoly houses dueling with light sabers. I crack me up, sometimes.)

On this chart, that line on the bottom is the normal level at which people expect to see foreclosures in the market. There’s always going to be some percentage of people who should not have bought the house and now they’re upside down late on payments. The real interesting bit here is that based on this chart we can see that there are still going to be some things coming onto the market or those people are going to be short selling. They’ll find a way through it, but they’ll have a better chance at a better way through it then they would have three years ago.

Some people argue that I’m not looking in the right place. They’ll say,

All those banks are just holding onto their houses. They just haven’t been listed yet. You’re not seeing them in this chart.

Well those people will have to keep arguing, or holding their breath, until part 2 of this series on Get Your PHX Market Briefing. That’s when I’ll share how I answer those people and I’ll share some relevant and interesting insights about the inventory that’s actually out here in Central Phoenix.

If you would like to be part of a future PHX Market Briefing, please contact me at 602-456-9388.

[train photo: andrew_j_w] [modified with permission by Ken Clark]

JUMP TO PART 2 OF THE MARKET BRIEFING HERE.

jp

November 17, 2012by phxAdmin
Events GYP, Life

Get Your PHX Family Thanksgiving

Thank you again to Amber Harrold of Camelbackpackers Hostel. Amber and her family put out an incredible spread for us, including local craft beer, wine and even camel-shaped cookies. If she went to those lengths for us, you can feel good recommending your friends to say at CamelbackPackers Hostel when they come through town.

As we roll in to the cooler weather we start to think about family and all of the holidays centered on spending time together.

This month, please join us for our first annual Get Your PHX Family Thanksgiving. You’ve all been so supportive of Get Your PHX and Cenpho businesses for so long that you really are part of the family. So, before you head off for your “other” family dinners in late November, please join your Get Your PHX family for one special thanksgiving meal.

Hob Nobs owners Bob and Sharilyn are preparing a very warm reception for us. In addition to their regular, vast menu of goodies, Hob Nobs is offering a Thanksgiving Sandwich special for just $10 -that’s a turkey and cranberry sandwich and a drink. In addition, they are offering a $1.99 craft bottle of beer, to be announced.

Hob Nobs is also organizing for their most popular musical act, DirtMusic, to entertain us for Get Your PHX. This band has travelled around the world to play its mix of alternative blues and bluegrass. You don’t want to miss this.

And, of course, I will be hosting the monthly raffle. Don’t miss out. Your PHX family misses you!

November Get Your PHX
HobNobs
November. 15th at 5:30
149 W. McDowell Road,  Map It
Phoenix, AZ 85003
November 4, 2012by phxAdmin
Light Rail, Phoenix News

Final Report: Greening Lower Grand Avenue

Two weeks ago, Lyssa Hall, Senior Landscape Architect for Parks Development at Parks and Recreation told me about the Final Report on Greening America’s Capitals: Lower Grand Avenue, Phoenix (PDF).

The report provides short, mid and long term strategies for the redevelopment of Lower Grand Avenue into a vibrant corridor.

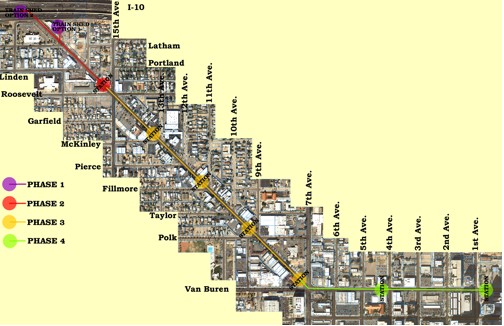
Here is a major development: it mentions a possible street car or trolley in the future. That is a HUGE win for the Grand Avenue Rail Project (GARP) which I wrote about a few weeks ago as being in danger of losing its Phoenix support when a neighboring city received a proposal to take our trollies and add them to their local museum.

The mention of the possible trolley in the Greening on Lower Grand report is not an endorsement by the city, but I believe that the city needs to get behind this economic development project.

I joined the non-profit Grand Avenue Rail Project (GARP) board shortly after it was first proposed and we are working to get recognition of what a great return on investment this represents. If funded, it would mean that you could ride the modern light rail in from the burbs, jump on the old Trolley and visit all the galleries and sites that will inevitably populate Grand Ave.

But, it is less about transportation than it is about what happens when you have a feature like this in an area like Grand. If you look at the buildings along Grand, most of them were built when Grand was THE shopping street in Phoenix. They are close to the road, the sidewalks are wide. Basically, the architectural environment is in place for new businesses to spring up. Behind those buildings are hundreds of old bungalows that have been largely neglected. A project like this will encourage historic renovation with the fervor that we saw around the light rail line recently.

That represents more dollars in the local economy, new businesses and higher value homes. All from a 1.5 mile trolley line.

And, who knows? That short trolley line could eventually make its way all the way around downtown. This is just a start.

Now, that’s economic development.

Now, as for the process:

It is the Parks and Recreation Department’s mission to be the best Parks Development Division in the nation. To this end, public meetings “community design workshops” were held over three days in Feb and March, put on by the Grand Avenue Merchant Association (GAMA) and the U.S. Environmental Protection Agency. The result of those meetings was finalized on September 10 by the Environmental Protection Agency and can be found in this Final Report:

The Streets Transportation Department will be presenting the findings from the workshop and report at the Parks, Arts, Families and Seniors Subcommittee on Oct 9th at 10am in Phoenix City Hall, assemble room A. If you are unable to attend the subcommittee meeting, they will be televised and archived for viewing.  

The estimated cost to build the trolley infrastructure, outfit a new museum on grand and operate the system: $10 million. I’ve heard transportation planners say $50. I think that is high for 150 year old technology.

Regardless, believe that the resulting new home sales, infill development and business starts along grand will be worth ten times that. Please contact your city councilmen and let them know that you support the Grand Avenue Rail Project.

October 4, 2012by phxAdmin
Page 1 of 91234»...Last »

Subscribe to Our Newsletter

We keep your data private and share your data only with third parties that make this service possible. Read our Privacy Policy.

Thank you! Please check your inbox or spam folder to confirm your subscription.

Categories

  • Art
  • Blogroll
  • Design
  • Editor's choice
  • Events General
  • Events GYP
  • Fashion
  • Featured
  • First Time Home Buyer
  • Homes
  • Life
  • Light Rail
  • Live
  • Market Analysis
  • NeighborhoodVideos
  • Phoenix News
  • Photography
  • Photoshootings
  • Profiles
  • Public Policy
  • Renovation
  • Renting
  • Restaurant Reviews
  • Sustainable Living
  • Tips
  • Uncategorized


© 2015 copyright GET YOUR PHX ® // All rights reserved // Privacy Policy