September Market Preview
From our friends at the Cromford Report. The take-aways:
- No, Karen, we are not in a bubble.
- We have a shortage, and we need more listings.
- Interest rates are very high, but that does not affect all parts of the market equally.
Here are the basics – the ARMLS numbers for September 1, 2023 compared with September 1, 2022 for all areas & types:
- Active Listings (excluding UCB & CCBS): 11,969 versus 18,694 last year – down 36% – but up 6.5% from 11,241 last month
- Active Listings (including UCB & CCBS): 14,476 versus 21,506 last year – down 33% – but up 3.8% compared with 13,945 last month
- Pending Listings: 4,604 versus 5,607 last year – down 18% – and down 4.9% from 4,842 last month
- Under Contract Listings (including Pending, CCBS & UCB): 7,111 versus 8,419 last year – down 16% – and down 5.8% from 7,546 last month
- Monthly Sales: 6,211 versus 5,916 last year – up 5.0% – but down 1.7% from 6,317 last month
- Monthly Average Sales Price per Sq. Ft.: $282.52 versus $286.71 last year – down 1.5% – but up a tiny 0.01% from $282.48 last month
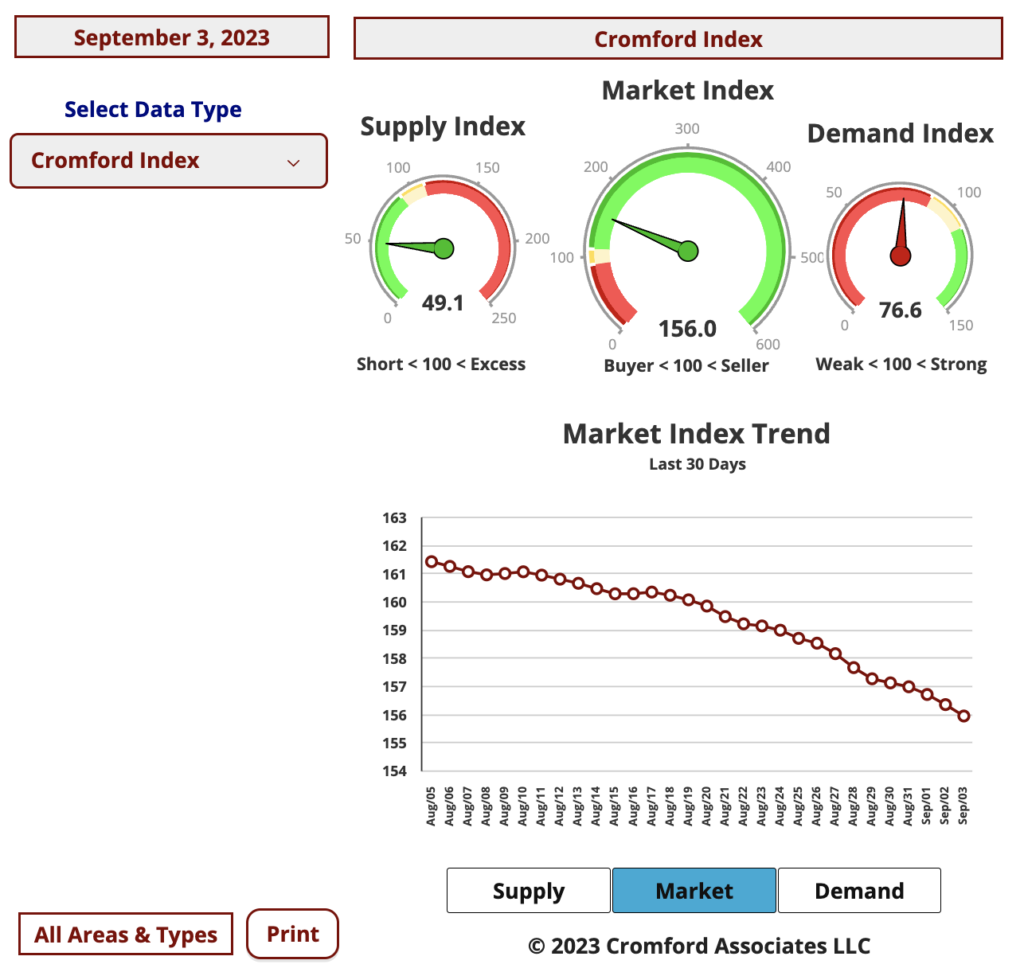
Despite comparisons becoming easier with last year, the market still looks in poor shape. We can see that demand is very weak with listings under contract down 16% from this time last year. The August closing count offers some relief from the gloom, rising 5% from August 2022, but with the 30-year fixed mortgage rate still north of 7%, qualified buyers are thin on the ground.
Sellers are also scarce. Some simplistic commentators are obsessed with imaginary bubbles and assume that if demand is weaker then prices will fall. Not the case. The fact that so many people think we are in a bubble is conclusive evidence that we are not in a bubble. The important measure is the balance between supply and demand, not demand on its own. Supply has been low for several years apart from the brief surge in the summer of last year. This was caused by panic among iBuyers and speculators, both trying to exit the market in too much of a hurry. At the moment supply is down more than demand is down, so prices are firm.
Without a large and prolonged increase in sellers, we won’t have the lop-sided market that causes prices to fall. We do have a small increase in supply compared with last month, but we are still down 36% from this time last year. If supply continues to grow at 6% or more for six months or more, then we could get back close to a balanced market, but at the moment we are seeing just the usual seasonal pattern. Supply tends to expand from August until mid November and then contract again.
It might seem that prices are weakening given that the median sales price is $435,000, having been $443,000 two months ago. This is a drop of 1.8%. However, luxury home sales are relatively scare in July and August and we can see evidence of this from the fall in the average home size between June and August. This dropped almost 3% from 2,022 to 1,965 over the same two months, so median prices falling less than 2% tells us the underlying trend is still positive. The luxury home market share and average home size will no doubt bounce back in October and we should be able to see the upward trend reasserting itself more visibly.
One geographic segment of the market looks more favorable to buyers than the rest, that being Casa Grande. Here supply is relatively plentiful with 296 active listings without a contract. To compensate for this, sales have been much stronger than last year. If pricing were to weaken, this would likely be the first place to detect it.


