October Market Update
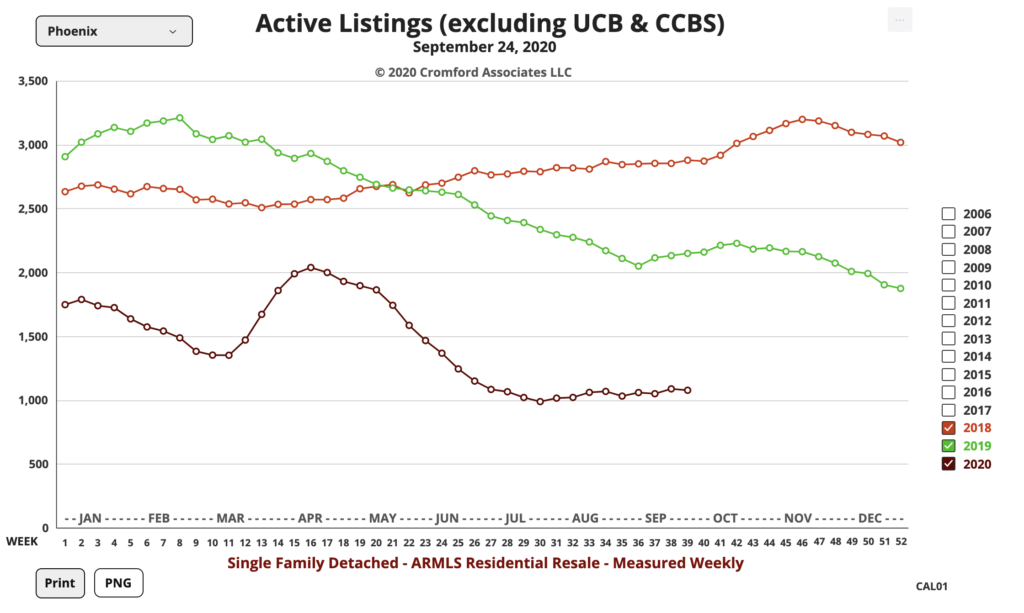
This October Market Update finds us with more listings coming on the market, but not enough to affect the supply in any significant way. So, don’t expect prices to drop as a result.
Plus, if you are thinking of listing, you are still in a good place to do it.
Here are some take-away’s from the Cromford Report’s analysis as we look toward the October market.
- Active Listings in September numbered 8,101 versus 13,755 last year – down 41.1% – but up 0.9% from 8,028 last month
- Pending Listings: 7,999 versus 6,011 last year – up 33.1% – and up 1.4% from 7,892 last month
- Monthly Sales: 9,667 versus 8,022 last year – up 20.5% – and up 4.9% from 9,213 last month
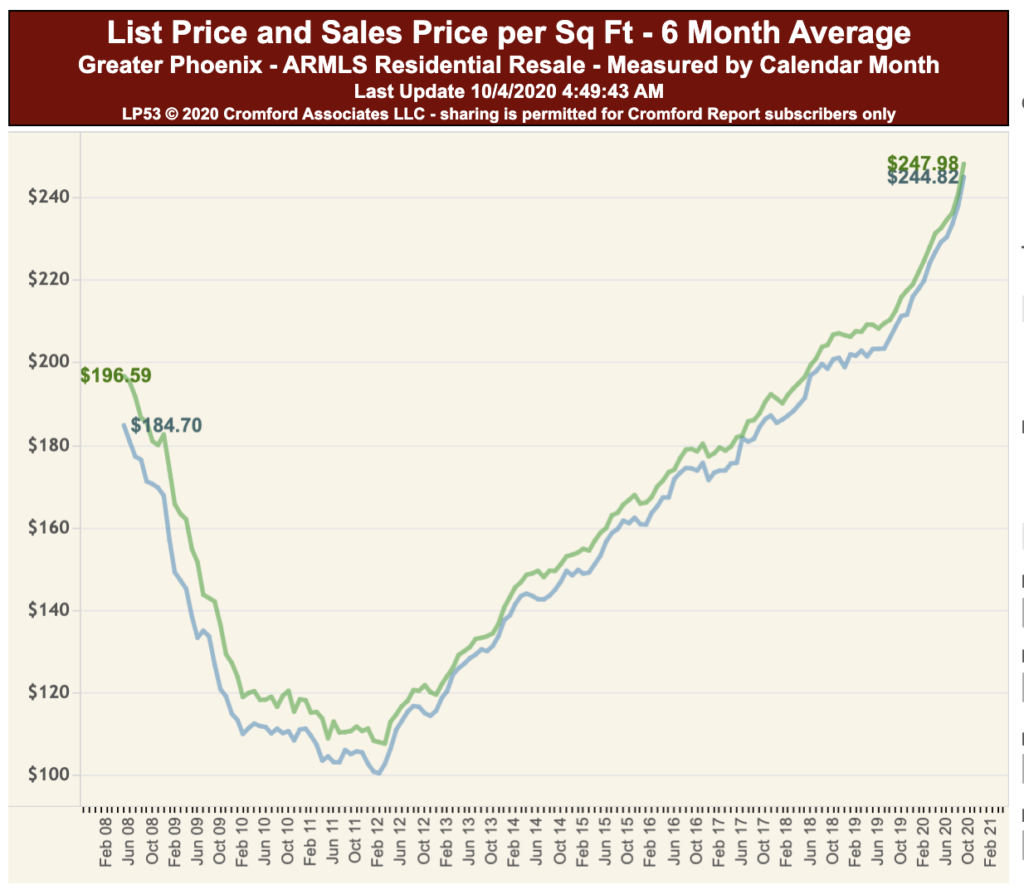
- Monthly Average Sales Price per Sq. Ft.: $198.68 versus $169.60 last year – up 17.1% – and up 1.9% from $194.98 last month
The flow of new listings was strong throughout September, with roughly 17% more listings posted than in September 2019. However this did not result in much change to the available supply.

With the chronic shortage of re-sale homes, many buyers are turning to new-builds. Here they will not face multiple offers, but they may well find some builders are not accepting contracts except for homes that are near completion. The reason is that prices are climbing steeply and some developers do not want to tie themselves to a fixed price until the home is almost complete. The builders are experiencing an extreme seller’s market and buyers (and their agents) are likely to feel a little less appreciated than usual.
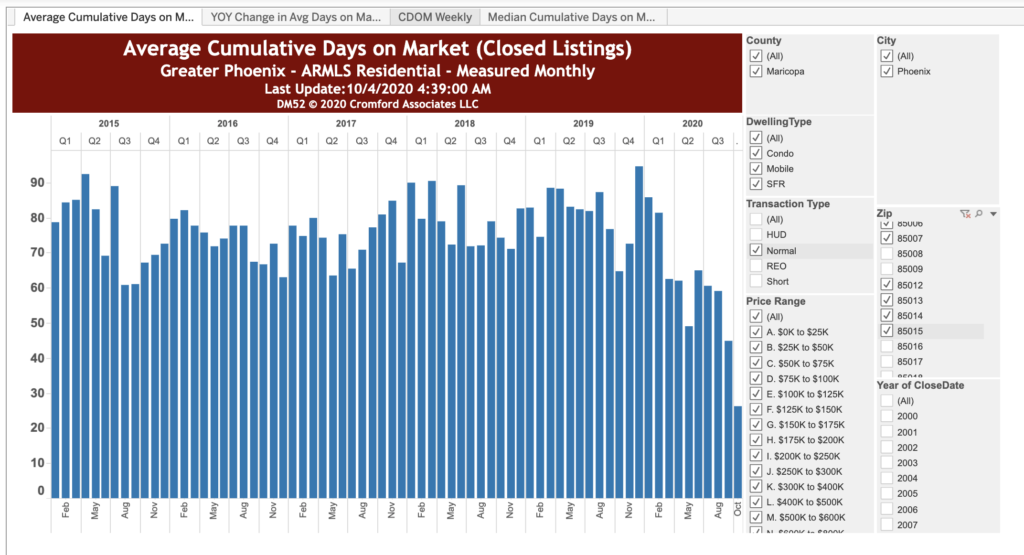
The reason that available supply is not increasing, despite the large increase in new listings, is that demand refuses to die down. It is unusual for the number of listings under contract to be higher on October 1 than September 1, but this is what we see in 2020. Even more startling is the amount by which the number of listings under contract exceeds the 2019 level – 34%. The market was strong this time last year, but now it is on fire.

There have been a number of articles written predicting that home prices will fall next year because of the damage to the economy by the COVID-19 pandemic. This will cause some people, those who took those article seriously, to be very surprised by the huge increase in pricing that is currently going on. The extremely high CMI reading indicates that the upward price trend will continue for the near and medium term, making any price reductions in 2021 rather unlikely.
Over the last 12 months, the average price per sq. ft. has increased over 17% and the current rate of increase in around 2% per month, meaning we are probably headed for an annual rate of over 20% fairly soon.
The economy has severely damaged the finances of a large number of people. However most of those people were unlikely to be in a position to buy a home anyway. Those who are in a position to buy a home have had their determination to do so increased dramatically by the pandemic. The gap between the haves and the have-nots is widening.

Foreclosure notices in Maricopa County numbered 99 during September. This is down 76% from September 2019. Some people are predicting that foreclosures will rise in 2021. The Cromford Report staff thinks that the record low levels of foreclosure activity in 2020 cannot last forever, but data released about delinquencies by the lending industry suggests that there is unlikely to be the sort of foreclosure flood that we saw in 2007 through 2012. Remember that the record monthly count was 10,712. That was truly a mountain of foreclosure notices and we currently have no more than a molehill.
Call us at 602-456-9388 if you need help building your strategy.
Here’s last month’s report, for comparison.

