November 2017 Market Update
I don’t have a crystal ball for this November 2017 Market Update.
I don’t know what is going to happen in the market in 2018.
But I do think it is wise to consider the probabilities. I do think that there will be some kind of market shift in 2018. It may only be 3 to 5 percentage points, but I think the changes are increasing every year.
Why do I say this? First, I’ve heard professional economists saying that the over-all economy is due for an adjustment.
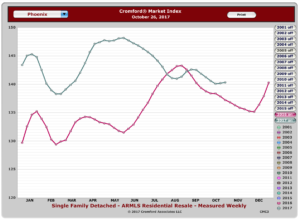
Second, I’m seeing the Cromford Index shifting downward from end of last year.
For you long-time readers, you will remember that the Cromford Index tracks whether we are in a buyer’s market or a seller’s market, and by how much. It also precedes market shifts because prices can still be going up while the Cromford Index is trending down. If you look at the chart here, you will see that the seller’s advantage has been weakening since about May. If we see that weakness in January and February, then expect prices to drop a little bit. (Nothing like 2009, by the way.)
Third, the market is crowded with renovation homes right now. Some of them are not that great, by the way. Based on past experience, this seems to be an indication that speculators are crowding the market. When we get too many listings on the market, I think prices will begin to drop.
Fourth, the chatter out there is about quick sales. This is usually a sign of a high market. We had clients who had 15 offers in the first 48 hours of listing their property. Sound familiar?
Our friends at the Cromford Report are not ready to take a stand like this for their November 2017 Market Update. Cromford sees prices strong for next month, expects more listings on the market, which could lower prices at end of year. Here is there take:

“Each month about this time we look back at the previous month, analyze how pricing has behaved and report on how well our forecasting techniques performed. We also give a forecast for how pricing will move over the next 30 days.
For the monthly period ending October 15, we are currently recording a sales $/SF of $150.21 averaged for all areas and types across the ARMLS database. This is up $1.10 or 0.7% from the $149.11 we now measure for September 15.
Our mid-point forecast for the average monthly sales $/SF on November 15 is $152.17, which is 1.7% above the October 15 reading. We have a 90% confidence that it will fall within ± 2% of this mid point, i.e. in the range $149.71 to $155.83.
So we are forecasting the same percentage increase over the next 31 days that we have seen in the average price of pending listings over the past 30 days. This means the third quarter slump is well and truly over and we expect the usual surge in $/SF for the fourth quarter.
Having said that, the actual number of pending listings is lower than usual. Only 2001, 2007 and 2014 saw lower pending listing readings as of October 15, so it appears that the current pricing level is putting a slight damper on demand, at least as far as pending counts is concerned. Sales counts are still looking healthy although the annual sales rate is no longer increasing as it had been a few months ago. This means the market is not expanding as fast as as it was in the first half of 2017. (Emphasis added)
If you are thinking about selling your home, it is a good time to have a deeper look at the data. Give us a call at 602-456-9388 so we can plan ahead and maximize your sale price.

