May Market Status
Our May Market Status Report is a mixed bag. Anecdotally, we are seeing shorter lines and fewer feeding frenzies for every listing.
The Cromford Report compares the numbers for May 1, 2022 compared with May 1, 2021 for all areas & types:
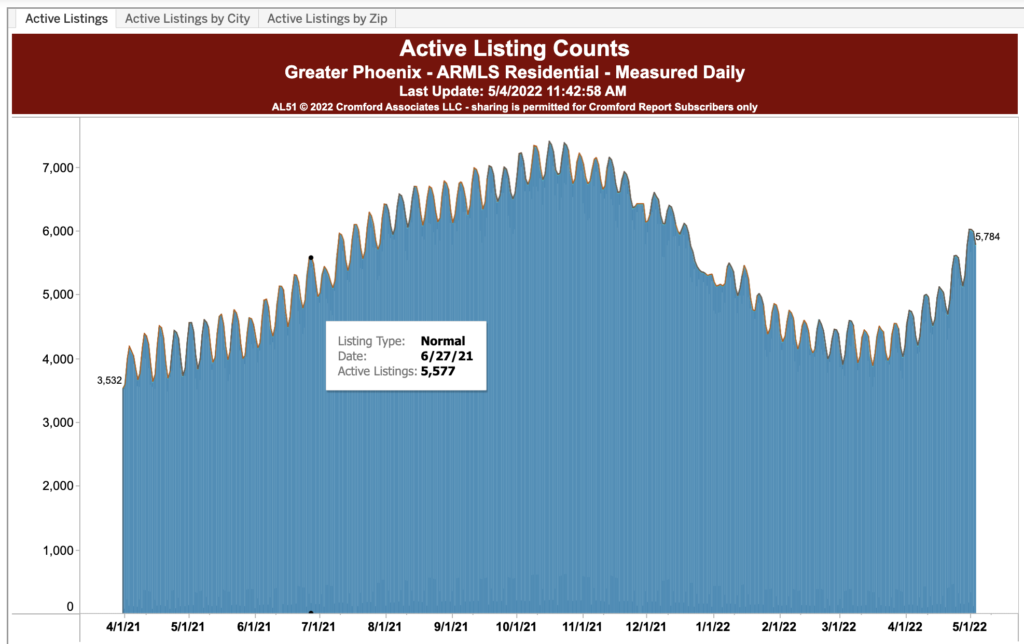
- Active Listings (excluding UCB & CCBS): 6,688 versus 5,080 last year – up 31.7% – and up 32.4% from 5,051 last month
- Pending Listings: 7,386 versus 7,829 last year – down 5.7% – and down 7.8% from 8,008 last month
- Under Contract Listings (including Pending, CCBS & UCB): 10,889 versus 12,187 last year – down 10.7% – and down 6.3% from 11,620 last month
- Monthly Sales: 9,270 versus 10,200 last year – down 9.1% – and down 8.6% from 10,144 last month
- Monthly Average Sales Price per Sq. Ft.: $302.64 versus $243.36 last year – up 24.4% – and up 4.1% from $290.75 last month
- Monthly Median Sales Price: $466,000 versus $373,000 last year – up 24.9% – and up 2.3% from $456,000 last month
To boil that down, the number of listings is up, but monthly sales are down and prices continue upward.
Cromford continues their May market status report:
“Between late October and mid March we saw a downward trend in supply. However this has completely changed direction over the past 6 weeks and active listing counts are rising very strongly. They are up more than 32% in a single month, one of the most dramatic shifts in direction we have ever seen. If this trend continues for several months the market dynamics will change significantly.
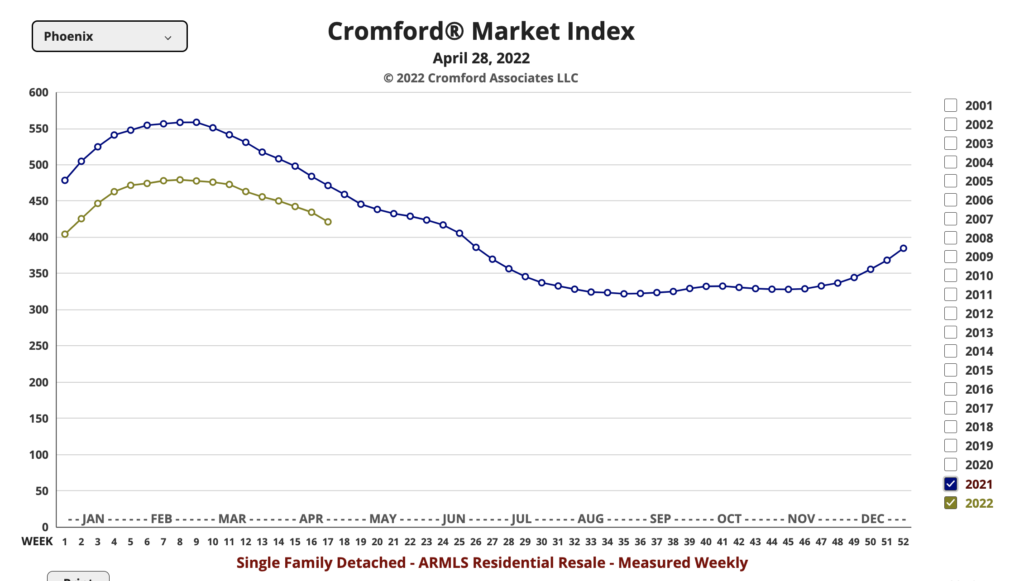
The large increase in supply is caused by a combination of factors. First, we are seeing more new listings arrive, possibly because people who have made large unrealized profits cash out while the going is good. Secondly, we are seeing a significant drop in demand as a sudden jump in interest rates and eye-watering prices discourage new owner-occupiers from entering the market. We note that listings under contract are down more than 6% since last month. Closed sales are also down more than 9% from April 2021. Demand is weak and getting weaker.
The overall effect is a major cooling event, turning a hot housing market into one that still favors sellers (for now) but is looking increasingly dangerous with each passing day. It only favors sellers because the supply is still very low compared with a normal market. But if supply continues to increase, as looks very likely at this point, we could quickly find ourselves with as many sellers as buyers. The market does not turn on a dime, but it can certainly change dramatically over a handful of months, as it did between August and November 2005. The charts today suggest we are now entering a very different phase of the market cycle.
Make no mistake – closed prices will continue to rise for some time – they are a trailing indicator and will only stop rising long after the market has cooled down. But it does not take too much imagination to envisage a situation where they overshoot. Right now we have just seen the average $/SF rise 4.1% in a single month. But this reflects the huge imbalance between supply and demand that existed two months ago. That imbalance is much smaller today and is shrinking noticeably with every passing day.
We are entering a much more uncertain period and great caution is advisable. The mid-range market between April 2021 and April 2022 has been largely driven by enthusiastic investors. If their enthusiasm dissipates and turns to fear we could see far more rapid change than we have become used to.”


