July 2015 Market Trends, Part 1
 Its mid-year and time to take stock of where the market stands.
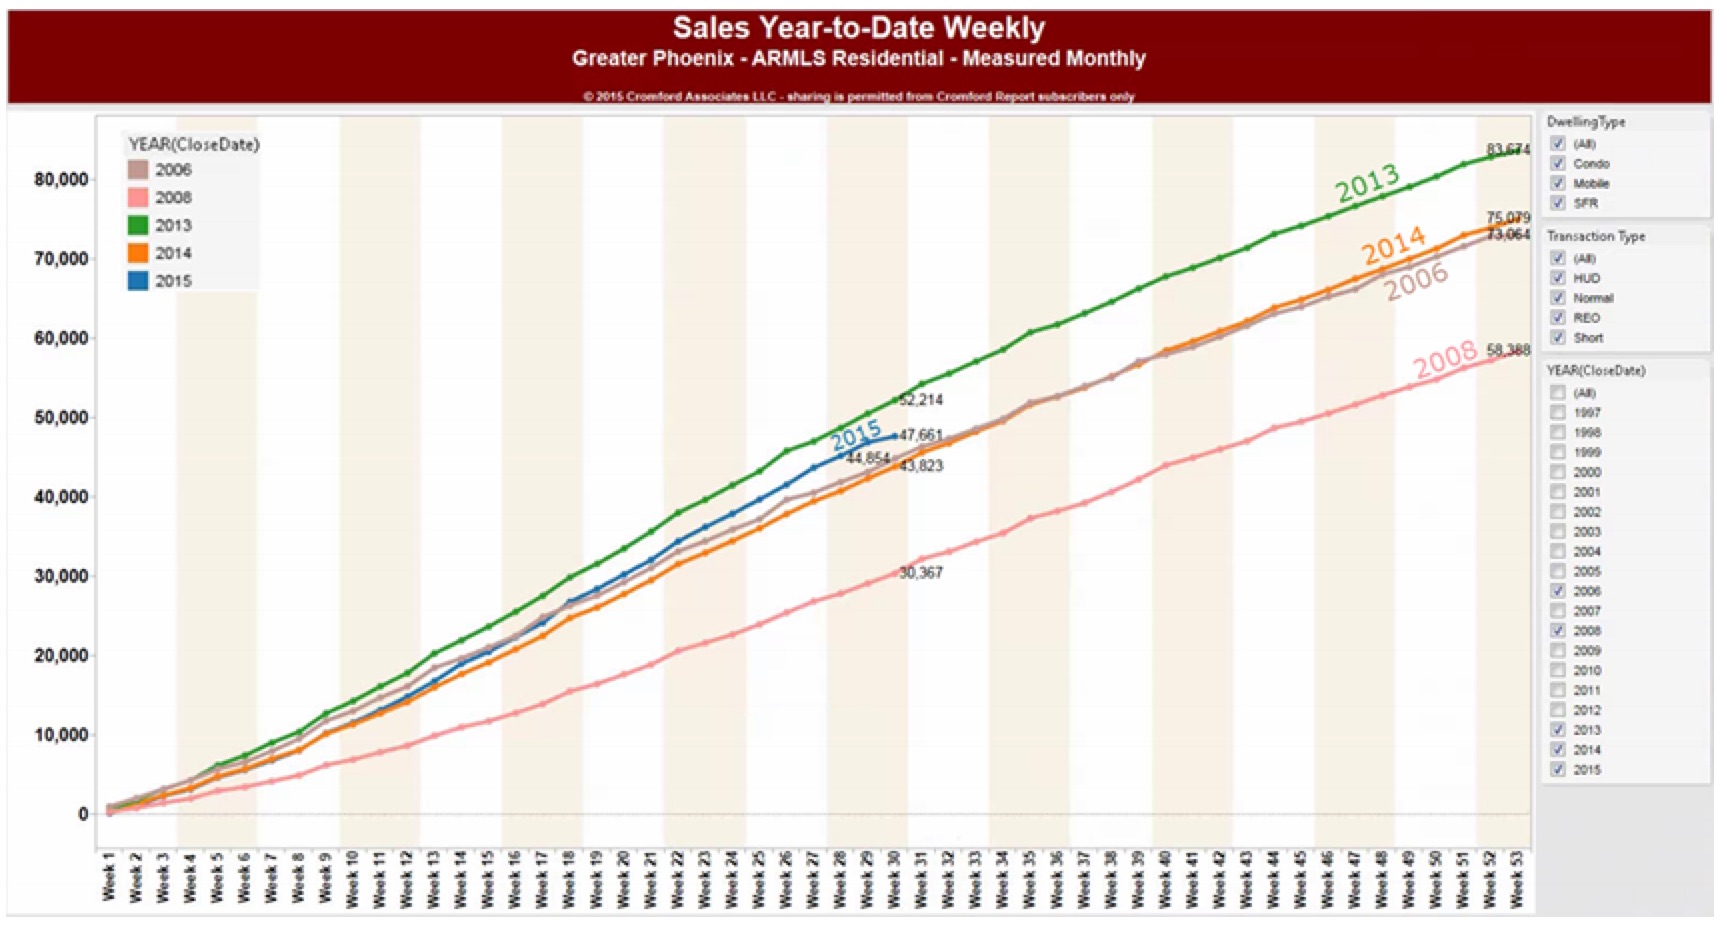
“Sales volume year-to-date so far in 2015 is 47,661 closings, up 8.8% from this week in 2014 but still 8.7% below 2013.
2006 and 2014 saw similar annual sales volume. 2015 has had 57% more closings than 2008, which was the infamous year prices crashed due to increasing foreclosure supply and decreased demand due to tightened lending standards.”
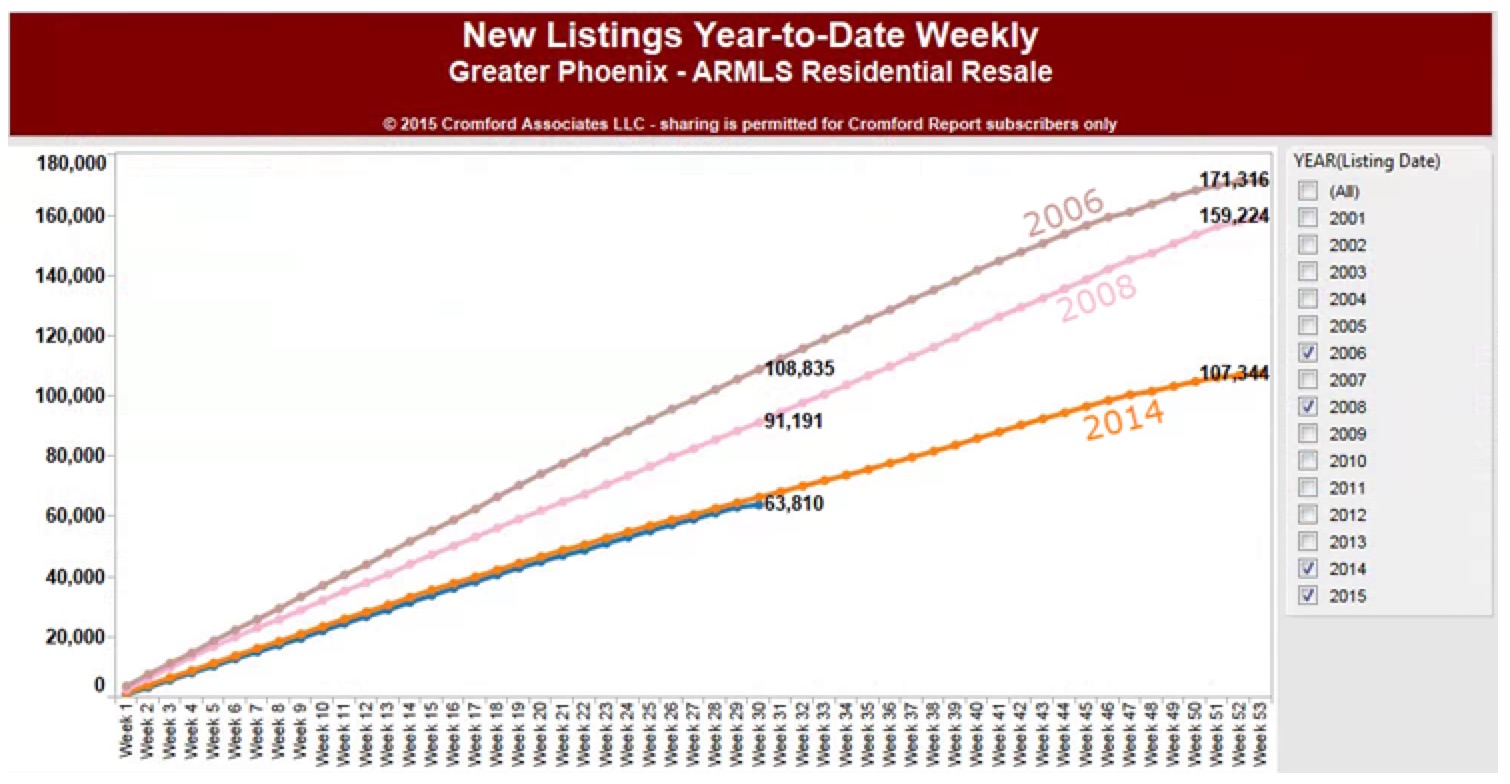
In other words, people in 2008 were listing them, but not closing. Whereas this year, they are listing them and closing them.
But, don’t take that strong activity to mean that we are heading toward another bubble. We’ve seen this year how there are not as many houses coming on the market as there were in 2008. This year’s price increases seem to be due to shortages, rather than people throwing houses on the market in reaction to a bubble.
 That is why you saw 91,191 listings in July of 2008 but only 63,810 as of this month in 2015. I suspect if prices continue to rise, more folks will be inspired to list their homes. But, we don’t seem to see that kind of irrational upward pressure right now.
So, what does this mean for you? It means that it is a good time to list, especially as people return from summer vacation in about a month. It means that you might want to buy before those people return and enter the market.
Let’s look at your specific situation and build a strategy. Call me a 602-456-9388.
Info Source: The Comford Report

