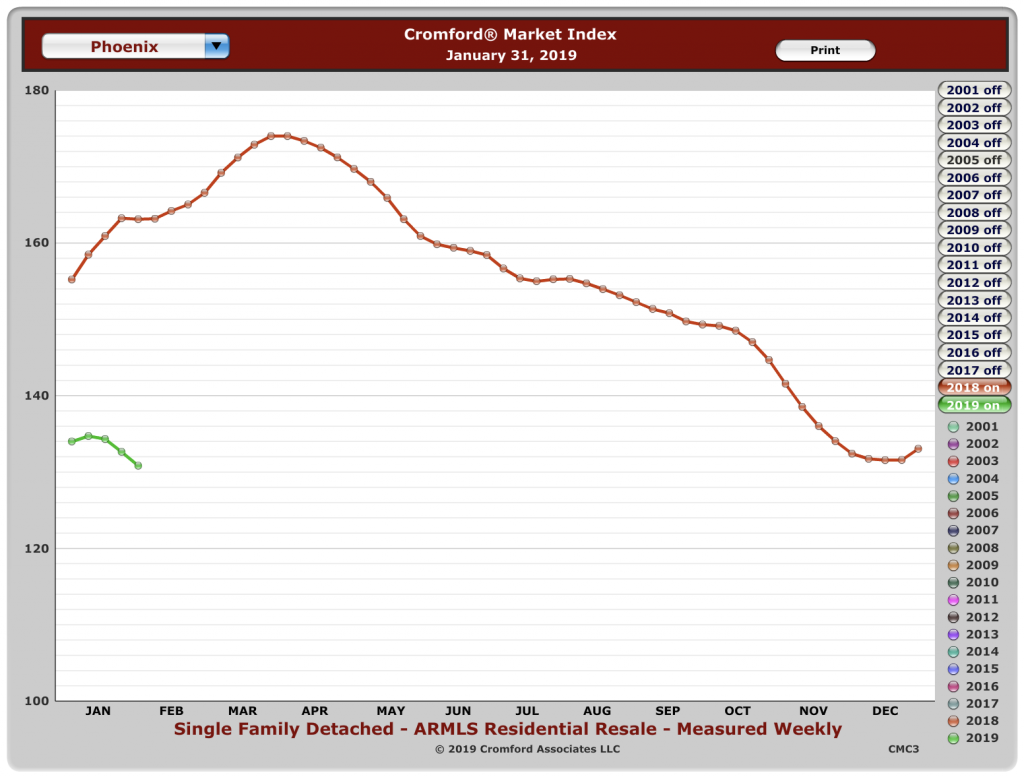
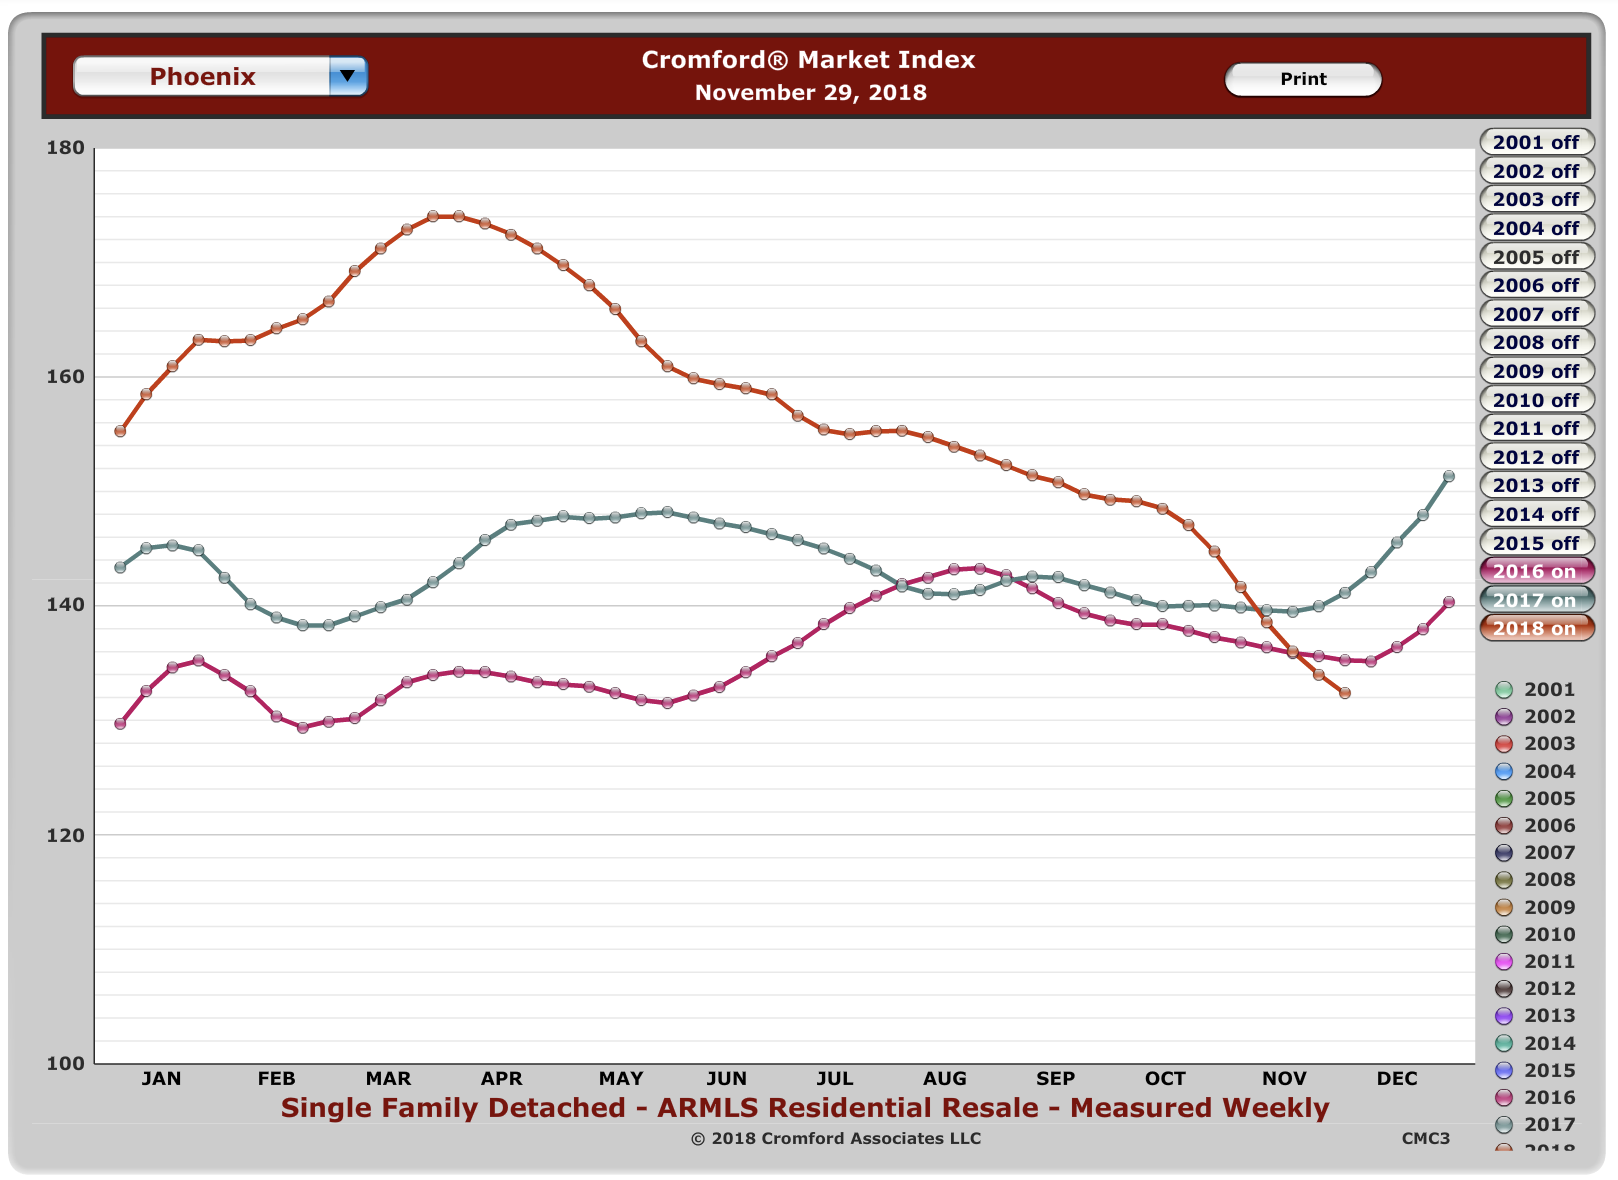
Our friends at the Cromford Report tell us that we are at the top end of what we would expect in terms of a normal appreciation growth in the market price of homes. See the last post for why that is. Yep! Wholesalers and flippers have been driving up prices.
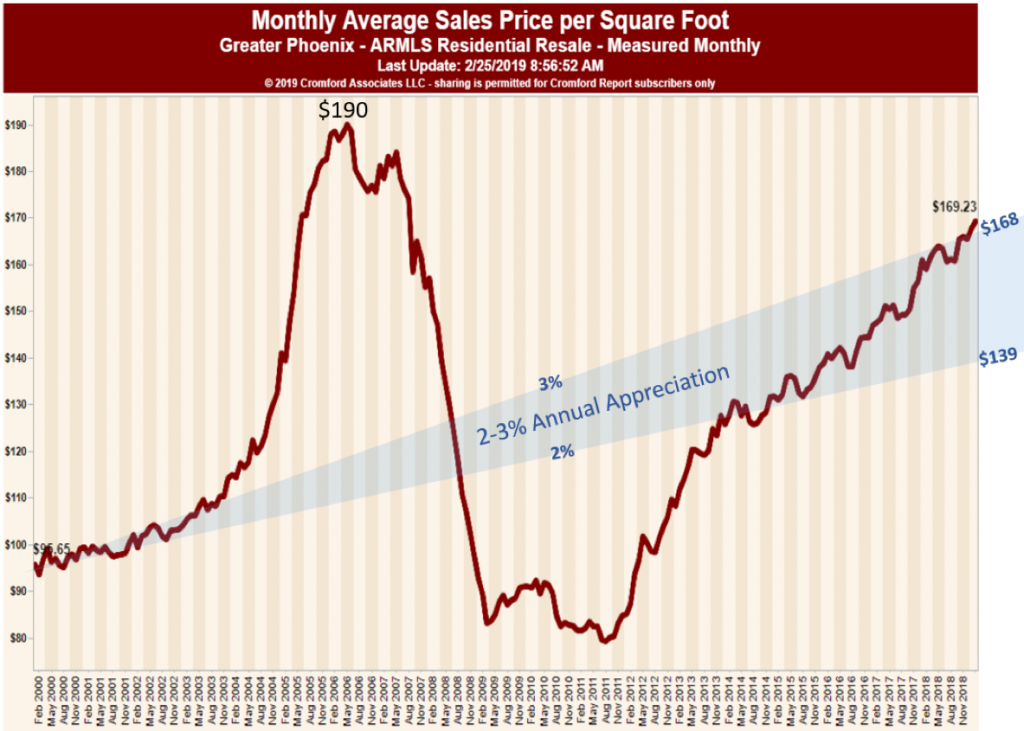
So, do we need a drastic drop in prices? Nope. What we need is for a move toward balance, at which point there will be plenty of buyers for good looking properties. (more on that in the next post)
So, what does that mean for you?
BUYERS: get your financing in order. As we will discover in tomorrow’s post, a re-balanced market could happen within a month or so. You are in a great place to start looking. Choose only the best home for you and don’t be afraid to haggle.
SELLERS: If you are on the market now, price accordingly. If you are coming on to the market, do those improvements and make the house really shine. Stand out from the others!
If you are thinking of selling, really polish up that property!
Also, from now until early June is the high season. Sell now if you are going to sell this year!
Call us directly for more insights at 602-456-9388.
 whether the sellers had to offer concessions, etc.