Get Your PHX - A Whole New Way to Experience Phoenix
  • Home
  • Our Blog
  • About Us
  • Contact
Get Your PHX - A Whole New Way to Experience Phoenix
Home
Our Blog
About Us
Contact
  • Home
  • Our Blog
  • About Us
  • Contact
Live, Market Analysis

Now Even Case-Shiller Knows I’m Right

Following on the heals of yesterday’s post about the market, I want to point to this article in the Republic in which it is pointed out that:

1) the Case-Shiller index (which I often decry as being inaccurate for our market) often lags local data and overstates market declines, and

2) Chicago has surpassed Phoenix as a foreclosure market. So, as we’ve been saying, the number of foreclosures is going down quickly here.

But here is the money quote: “Careful calculations show the once-scary shadow inventory in Phoenix is no longer as large as many thought, and what remains can effectively be cleared out in about a year.”

What does this mean? It means that your ability to buy an uber-cheap home is slipping away. Call me for more information: 602-456-9388.

July 28, 2011by phxAdmin
First Time Home Buyer, Homes, Market Analysis

Phoenix Business Journal Changes its Tune

OK, folks. You’ve seen my critique recently of the Arizona Republic’s negative Nancy routine around real estate. Only recently have they admitted that the sky is not about to collapse on us like a giant chalupa.

So, the Biz Journal is starting to change its tune, too. A recent Phoenix Business Journal blog discussed the idea that the Phoenix real estate market is starting to stage a comeback.

But unlike a late inning rally, this comeback will take years before things return to normal with some experts saying 2013 or even 2014. So says Michael Orr of my favorite real estate stats table, The Cromford Report.

So what does this mean for you? Well, if you have the money, this is the time to pounce on available real estate. Many experts agree that the worst is behind us in terms of low housing prices and that they can only increase.

Scott Golba, a local real estate manager tells us that “This is not the time to go out and buy one home. It’s time to buy two or three homes.”

You got that emphasis, right? Buy two or more!

This will be a two-fold benefit for investors, as so many people are unable to put down the necessary payment to buy a house and instead opt to rent. This is positive cash-flow into a buyer’s pocket that can easily pay for a majority, if not more, than the cost of the home over a period of time.

So, give me a call and I can answer all of your questions regarding the housing market in Phoenix. I can help you find the home of your dreams or the home that meets your investment plans. 602.456.9388

July 27, 2011by phxAdmin
Homes, Live

Solar House Price Reduction

Hey, all.

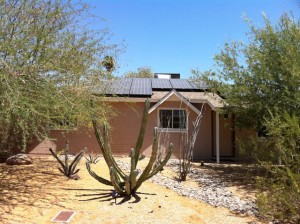
You may recall that my clients Seth and Ben are selling their 1,274 sqft. home with the 3.6kW of solar panels and lots of energy saving goodies. See here.

Well, the price has just dropped! You will want to see this. Now at $139,000.

It is an amazing house. The solar panels mean that you pay about $50 per month (average) for APS power and about $50 per month for the lease on the solar panels.

Solar City, the company that leased the panels to them two years ago covers them with a warranty and will fix them if anything goes wrong for the life of the lease (now 13 years).

Please let me know if you’d like to see this house. 602-456-9388

It is perfect as a rental near ASU, too!


July 26, 2011by phxAdmin
First Time Home Buyer, Homes, Live

Another $42,000 Beauty

If you are new to this blog you may not know that I am a HUGE fan of my condo complex. This property was built in the 1950s, was an apartment building until 2004, when it “went condo”. It is a great example mid-century modern architecture and the units are big –especially for the price.

This 2br/1.75 bath, 1,106 sqft unit is going for $42,000. Less than the price of many cars these days!

So, it stands to reason that I get excited about the idea of helping owner-occupants purchase these incredible units. I don’t represent this seller, but I can help you grab this unit. Note: they go pretty quickly!

Give me a call at 602-456-9388.

If you want a little history, check out this blog post about the renovation of the house that also sits on the property.

Here are some more photos.


July 18, 2011by phxAdmin
Live, Market Analysis

Geekin’ out With Cynthia Lujan

Admit it, you’ve missed my usual fun-lovin’ and humorous market analysis over the last month. “What will I do with my time without Ken’s market analysis now that Modern Family is on summer break?”, you say.

My apologies. It’s been a nutty month. Between closing properties, showing new ones and the Independent Redistricting Commission, I’ve been running around like a blue-arsed fly (ask your Australian friends).

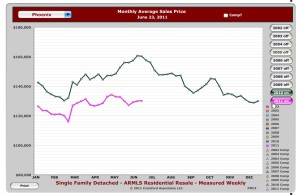
But, Cynthia Lujan from Old Republic Title Company delivers with a really handy June month-in-review.

Executive Summary: “If you are still waiting for that mythical second wave of foreclosures, you are more likely to see Snookie settle down in a commune of vegetarian, celibate, palm readers before that will happen.”
Market Headlines

·         Supply continues to fall, though rather more slowly in the ranges between $200,000 and $800,000.

·         Demand very strong below $200,000 but showing seasonal weakness above $200,000.

·         Average sales price per sq. ft. is stable below $300,000 and increasing above $300,000.

·         A change in the sales mix could adversely affect overall market average prices and medians.

·         Foreclosure activity declining and active REO inventory is at the lowest level for several years.

Homes under $100,000

·         Demand remains strong while supply is still declining. Prices now stable for 7 months.

·         Demand normally falls off during the summer but the demand in this price range is dominated by intense buying by investors who are only slightly affected by the seasons.

·         Active listings are now 7.8% below this time last year.

·         This supply continues to gradually shift away from REOs (down 15.7% in the last month) towards short sales and pre-foreclosures.

Homes Between $100,000 and $200,000

·         Supply down and demand fading slightly. Pricing remains very stable.

·         Having peaked in October, supply has fallen another 6.8% in the past month and is down 23.4% when compared with March.

·         Demand has faded a little, but this is in line with normal seasonal patterns.

·         REOs dropped to 38% of monthly sales while normal listings also fell to 38%. Short sales and pre-foreclosures increased from 21% to 24% of sales.

Homes Between $200,000 and $400,000

·         Buying interest falters a little although supply continues to decline. Pricing remains very stable.

·         The supply of single family homes dropped by another 4.1% between May 26 and June 26, and is now down 17.0% over the last three months and 29.2% over the last year.

·         Over the last month REO supply actually rose by 2.4% reversing an 8 month trend, while short sales and pre-foreclosures fell by 3.0% and normal listings fell 5.5%.

Homes Between $400,000 and $800,000

·         Supply falling but demand continues to weaken. Nevertheless sales prices remain on an upward trend.

·         Single family homes between $400,000 and $800,000 have experienced a 6.4% fall in active listings in the last month.

·         The sales volume strengthened slightly in June, with monthly sales up 7.0%.

·         REO supply didn’t change during June at 84 homes, but this is down 10.6% over the last 3 months.

Homes over $800,000

·         Demand weakens for the summer months but supply is down again. Sales prices continue to climb.

·         We see the first sign of the spring season turning to summer as pending sales start to fade.

·         The good news is that the supply of homes above $800,000 fell 8.5% in one month, 18.9% over three months and 29.2% since June 2010.

·         Active REOs rose 18.4% from 38 to 45 over the last month but these represent only 2.9% of total active listings.

June 30, 2011by phxAdmin
Homes, Live

Solar House in Tempe for Sale!

It costs upwards of $30,000 to put solar panels on your house.

Or, you can just buy a house with solar panels on it already and save gobs on your electric bill.

This 3br/2ba home, for sale at only $149,000 has 3.6 kW of solar panels on the roof. What does this mean? It means that the owners, Ben and Seth, pay less than $100 per month for electricity –even in the summer.

They have a lease for the panels from Solar City, which were installed in 2009. That means that about $50 per month goes to pay the lease and “much less than” $50 per month, according to Seth, goes to pay the connection fees that APS requires for back-up power. (You know, for the 5 days that its cloudy in AZ.) See the listing for more details.

So, as the cost of electricity goes up for everybody else at over 6% per year, yours will probably increase at somewhere closer to 2%.

It also means that they are constantly off-setting CO2 emissions, just by being there. Since being installed in May of 2009, these panels have generated 13,308.00 kWh, or $2,395 worth of electricity. Their system has offset 17,048 lbs of CO2, or the equivalent of 8.1 mature trees.

Better still, this is a really beautiful home in Tempe, close to freeway access and shopping.

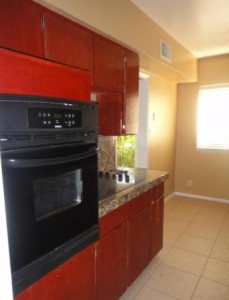
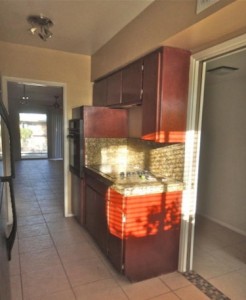
Ben and Seth did a wonderful job on the property, with water-saving desert landscaping, energy efficient windows, sky lighting via energy efficient solar tubes, a new kitchen and tile throughout.

This house presents an interesting example of a trend in Arizona. Many homes now have had solar panels installed through up-front purchase or a lease programs. Many of these are on the market –but a large percentage are $1 million+ homes!

This solar home is well within reach for the average buyer. And that means that the buyer, benefits directly and financially from whatever the seller installed. In some cases, the buyer takes on the lease for the solar panels, so be certain to talk with your lender about that. In those cases, the lease costs are relatively low, as are the electric payments. In this case, the buyer is taking on a lease for about $50 per month, but the total cost of electricity is lower than the average home, even when you combine the APS payments and the solar panel lease.

By installing solar tubes in the kitchen and the bathrooms, they also cut down on the amount of electricity needed to heat and cool the home.

This property is worth a look. It is bright, neat, well presented, in a great neighborhood and, in a way, pays for itself with the sun’s energy!

Learn more by clicking the pictures, clicking here or calling me at 602-456-9388.


June 20, 2011by phxAdmin
Live, Market Analysis

Even the Appraisers are Seeing It

What’s the opposite of a canary in a coal mine?
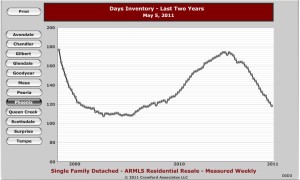
I’m looking for that phrase that means indicator of good things to come.

Oh, I know: property appraiser.

At least for now, that is.

I saw the following quote in an appraisal that my client got for her new home purchase yesterday –a home that appraised at $35,000 above sales price.

“Over the past year the sales prices in this area have fluctuated. The prices have increased since a year ago and are now starting to stabilize. The data collected reflects homes in the subject’s market area that are considered comparable to the subject in design, size, age, and quality. It appears the market is stabilizing in this market area and the absorption rate is declining.”

OK. So, hurray, right? My client has $35,000 of instant equity. I don’t think she could have bought at a better time.

But, let me put this in to context for you.

1 year ago –We agents were seeing data that indicated that home prices (especially in Central Phoenix areas) were stabilizing. The press stuck to the chicken little narrative, of course.

9 months ago –Appraisers were consistently coming in low on their appraisals, by wide margins, even though buyers and sellers were valuing property higher. This was great for some of my buyers, as I could then get the seller (usually the bank) to drop the price for us. This was a pain for sellers, of course. It also seemed terribly unfair for sellers of historic homes. See, as of about 2008 appraisers are assigned to appraisal jobs from a blind pool, and we often got appraiser from the suburbs who did not know the first thing about historic homes and completely undervalued them.

4 months ago –We were seeing much more evidence that the market had turned, with fewer foreclosures and multiple offers, but the appraisals were still coming in low. I think the appraisers were reading the Arizona Republic.

Today — Appraisals are coming in on the nose (more so in Central Phoenix real estate areas). And, like the one above, they are actually recognizing the shifts toward recovery. I also started noticing when I did comparable analyses for people that the “sold” prices were showing up as higher than the listing prices.

So, my client got the absolute sweet spot for buying this house: the prices are going up, but not everybody sees that, so she could get a great deal. Then, the appraisal comes in over asking price so the bank is happy to lend money and my client has built-in equity.

Does this mean that appraisers are going to drive a price spike? Not likely. See the problem during the bubble years was that appraisers were told with a wink an a nod what market value the buyer needed to close the deal. (I was not an agent then.) They can’t do that now because you will never know who your appraiser is going to be.

Anyway, this is a good omen. I’m sure it is more applicable to historic homes and CenPho than the burbs, but this is a milestone in my book.


June 14, 2011by phxAdmin
Live, Market Analysis

Finally, They Admit It!

The Arizona Republic this weekend finally admitted what we in the industry have known for a while: “Foreclosure homes are selling fast in the Valley as investors jump at the low prices, and experts don’t think the area’s shadow inventory will suppress prices further.” See the full article here.

They start out the article as they have so many before with talk of this “shadow inventory”, or the number of homes that are foreclosed (but not on the market) or that may foreclose soon because folks are late on their payments.

In previous stories they have used this looming menace to tell you to hide your kids, build a fall out shelter and stock up on duct tape. Over the past six months I’ve told you several things, most importantly the following: 1) banks won’t let the houses out faster than the market can absorb them, in order to protect prices, 2) the number of foreclosures have gone down steadily over the past 6 months and 3) foreclosed homes are selling faster every month.

Finally, they are telling us what I’ve been saying: those homes are selling quickly and they are gaining speed. In addressing why the “shadow inventory” of 92,000 homes is not a serious problem, they actually put it in to context this time:

“That’s because the rate of sales is as important as the raw number of homes. If sales are brisk, the homes are snapped up quickly, meaning they won’t lead to lower prices.”

They say that 92,000 foreclosed homes is 12 months worth of sales. That is about 7,600 sales per month. That is about right. And given the increasing speed at which they are selling, I think that is a little long.

Consider also that the “shadow inventory” in Phoenix is lower than in the suburbs, where all the explosive building 5 years ago made a housing glut. I’m seeing bidding wars over houses that are going under contract in weeks, not months.

Well, its great to see the shift. Watch now as the media shifts from the “woe is us” tone to the “signs of recovery” tone over the next year.

Not to ramble too much, but there is a lot to be said for trying to diversify our economy here in Arizona so this does not happen again. We were on the right road with renewable energy, but then it kinda just petered out! Check out this interesting article on the issue of economic diversification.

May 31, 2011by phxAdmin
First Time Home Buyer, Live, Market Analysis

Anecdotal Evidence

Average Days on Market Going Down!

You’ve seen my charts, graphs and data on this blog over the past six months as I make the case that either (1) homes actually are going up in price or that (2) the local news media has its head stuck up some, er …., shall we say, “dark cave” when it comes to predicting the way the market is going.

So, here is a bit of anecdotal evidence to further the case.

About three weeks ago a couple clients of mine and I started narrowing down the list of houses that they wanted to see when they came to town last week. We started with a list of over 20 properties that were “favorites”. This was the short list of properties that we might want to see.

By the time they got here, half of those had accepted offers. Further, during the time that we were looking at what was left another one went under contract. Luckily we found the perfect property for them anyway. And what happened? There were multiple offers on the property.

I am constantly amazed at how quickly these properties are going as I show people around Central Phoenix. If I were to isolate the average “days on market” for properties in Central Phoenix, versus the rest of the city (not even the rest of the valley), I’m confident that they would be on the market for 20% to 30% less time than anywhere else.

Oh, but there’s that data again.

Several things are happening to make this trend (gleaned from anecdotal conversations with clients):

1) The economy is getting better. Yes, it is slow, but it is enough that those who have jobs are feeling more comfortable about making home buying decisions.

2) Gas prices. As gas prices go up, more people are looking in CenPho. I hear it from my clients all the time.

3) People are looking around and seeing that houses are going more quickly, so they are making decisions more quickly themselves.

If you have been putting this decision off for a while, call me at 602-456-9388 before the lower inventory results in higher prices.

May 17, 2011by phxAdmin
First Time Home Buyer, Live, Market Analysis

More Evidence

I know that I’m a total broken record, but here is a quick point that I want to make. Actually my broker at John Hall & Associates shared this with me.

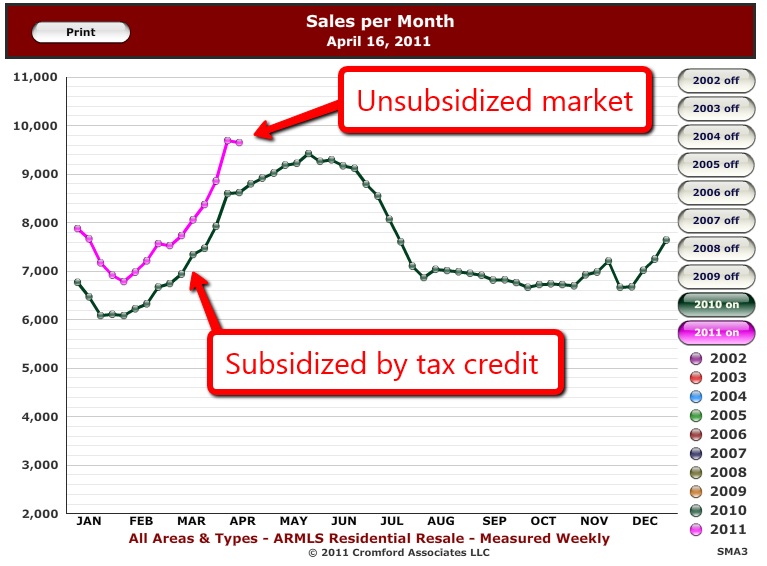
In the graph below you see the sales per month over the last couple months versus last year. The labels are clear. Last year with the subsides (federal tax credit) our sales per month were lower than they are today with no subsidy.

Need I say more?

Buy in Phoenix! Buy short sales in Phoenix! Buy foreclosures in Phoenix! Call me at 602-456-9388.

April 29, 2011by phxAdmin
Page 27 of 39« First...1020«26272829»30...Last »

Subscribe to Our Newsletter

We keep your data private and share your data only with third parties that make this service possible. Read our Privacy Policy.

Thank you! Please check your inbox or spam folder to confirm your subscription.

Categories

  • Art
  • Blogroll
  • Design
  • Editor's choice
  • Events General
  • Events GYP
  • Fashion
  • Featured
  • First Time Home Buyer
  • Homes
  • Life
  • Light Rail
  • Live
  • Market Analysis
  • NeighborhoodVideos
  • Phoenix News
  • Photography
  • Photoshootings
  • Profiles
  • Public Policy
  • Renovation
  • Renting
  • Restaurant Reviews
  • Sustainable Living
  • Tips
  • Uncategorized


© 2015 copyright GET YOUR PHX ® // All rights reserved // Privacy Policy