Get Your PHX - A Whole New Way to Experience Phoenix
  • Home
  • Our Blog
  • About Us
  • Contact
Get Your PHX - A Whole New Way to Experience Phoenix
Home
Our Blog
About Us
Contact
  • Home
  • Our Blog
  • About Us
  • Contact
Live, Market Analysis

May’s Market Status

Our friends at the Cromford Report are always great about allowing us to share their analysis. As an agent, their information really gives me an edge that will benefit you.

Here’s are some highlights from they have to say about why we have seen a sudden shift to a seller’s market:

April continued the trends we saw in March with significant improvement in demand and volumes, though different price ranges are experiencing very different supply dynamics.

Currently the supply situation is the most important thing to watch and this is what determines how much competition buyers will experience.

Here are the basic ARMLS numbers for May 1, 2015 relative to May 1, 2014 for all areas & types:
    •    Active Listings (excluding UCB): 21,512 versus 26,205 last year – down 17.9% – and down 3.5% from 22,303 last month
    •    Pending Listings: 7,951 versus 7,199 last year – up 10.4% – and up 1.2% from 7,853 last month
    •    Monthly Sales: 8,363 versus 7,572 last year – up 10.4% – and up 6.0% from 7,887 last month
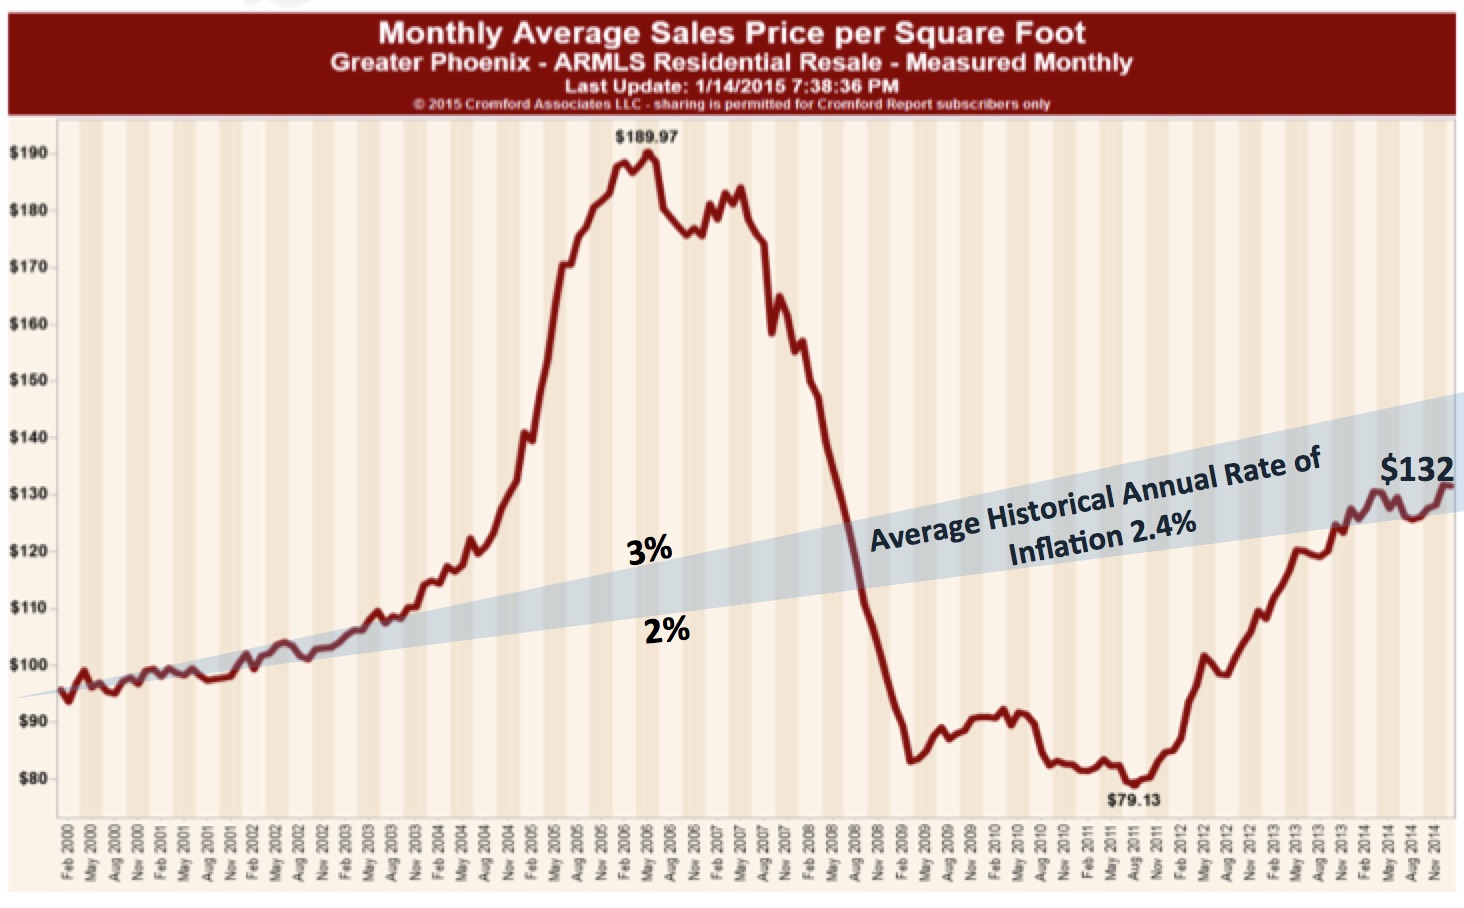
    •    Monthly Average Sales Price per Sq. Ft.: $135.88 versus $130.27 last year – up 4.3% – and up 2.9% from $131.99 last month
    •    Monthly Median Sales Price: $202,000 versus $190,000 last year – up 6.3% – and up 1.0% from $200,000 last month

From a seller’s perspective there is a lot of encouragement in this batch of numbers, though buyers might be dismayed to see price per sq. ft. rise by almost 3% in a single month.

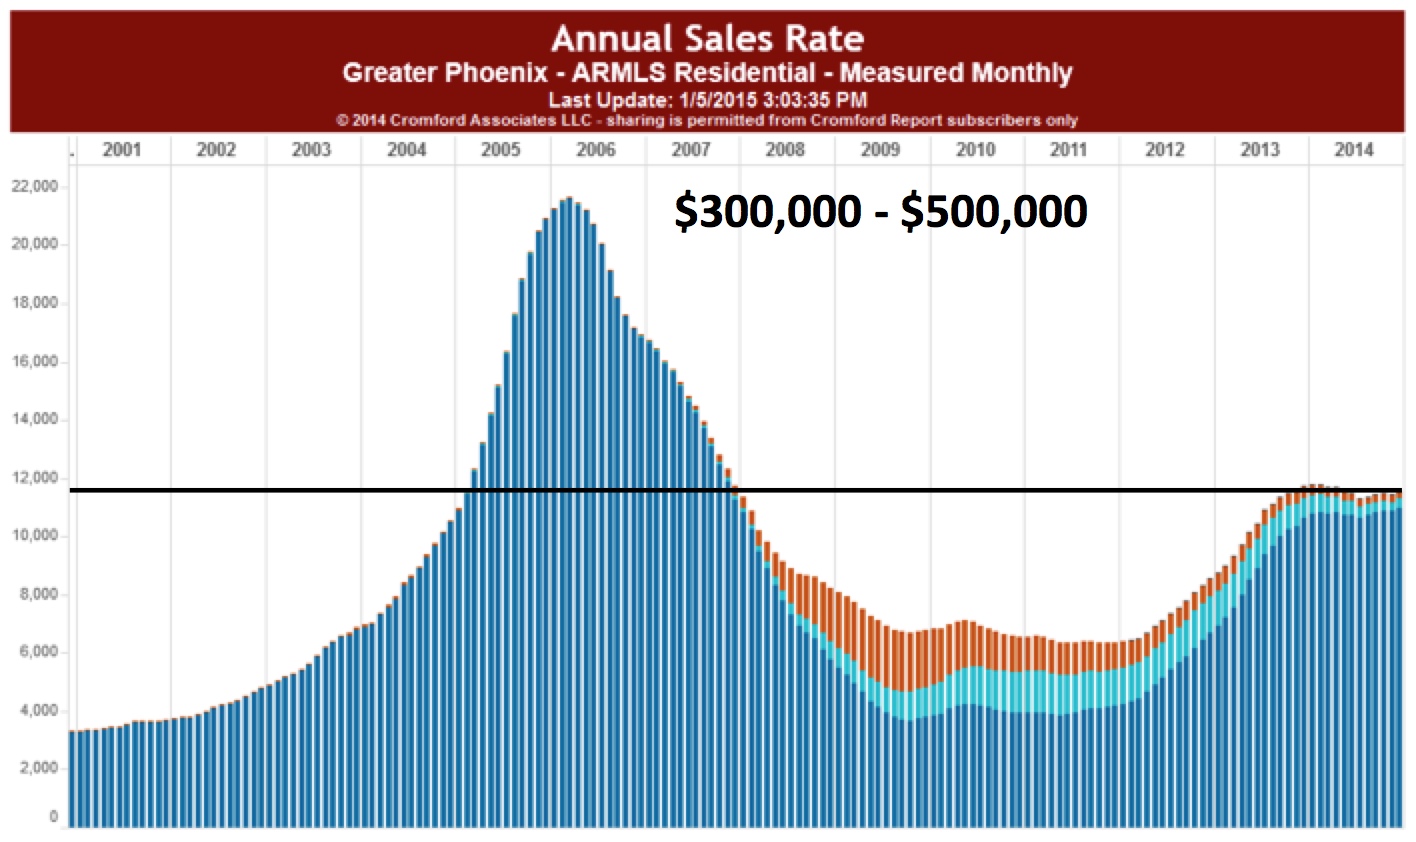
For the sub-$200K price bands we are seeing mostly unexceptional demand, but exceptionally low supply, which is leading to multiple offer situations and strong upward price pressure.

As we move upmarket from $250K, things become a little easier for buyers because supply is less scarce. Once we get above $400K there are more active listings than last year and most buyers are having a much easier time with less competition from other buyers. In other words, demand is good but supply is plentiful at these higher price points.

Personally, I would add my own analysis here to mention that homes in the historic areas and CenPho tend to command higher prices than most areas. So, our experience with our clients right now shows that this tightness in supply goes up closer to $300k. In other words, it is difficult to get offers in quickly enough for nice listings in historic areas, even at the higher prices.

If you are thinking of buying or selling, please give me a call and I’ll help you put a strategy together, which takes these trends in to account. Call me at 602-456-9388.

May 14, 2015by phxAdmin
Live, Market Analysis

Average Days on Market April 2015

If you want a good measure of which direction the market is going, take a tip form our friends at the Cromford Report: watch how many days it takes on average for homes to sell.

From Cromford:

“April 20 – There is one “average days on market” measure that is actually quite useful but almost nobody measures. This is the average number of days on market for pending listings. We can interpret it as follows:

For all areas & types the following guidelines apply

  • under 60 means a very hot market
  • 60- 70 means a hot market
  • 70-80 means a warm market
  • 80-90 means a balanced market
  • 90-110 means a cool market
  • over 110 means a very cold market

The absolute number is probably less useful than the trend. When the number is falling, the market is improving and when it is rising it is deteriorating (from a sellers perspective).”

Ave Days on Market-2015-04

So, have a look at this chart, showing average days on market for the zip codes which house the major historic neighborhoods, plus much of central, north central and downtown corridors.

The first three months of the year show a distinct drop in days on market. The over-all condition is much lower than it was just four years ago. But, this current trend tracks with what I was seeing in my last post about the seller’s advantage we are seeing right now.

If you need help navigating what all of this means and applying it to your personal situation, please give me a call at 602-456-9388.

April 22, 2015by phxAdmin
Live, Market Analysis

Seller’s Advantage is Here

Last month, I pointed out that the Cromford Cromford Index 2015-04-22
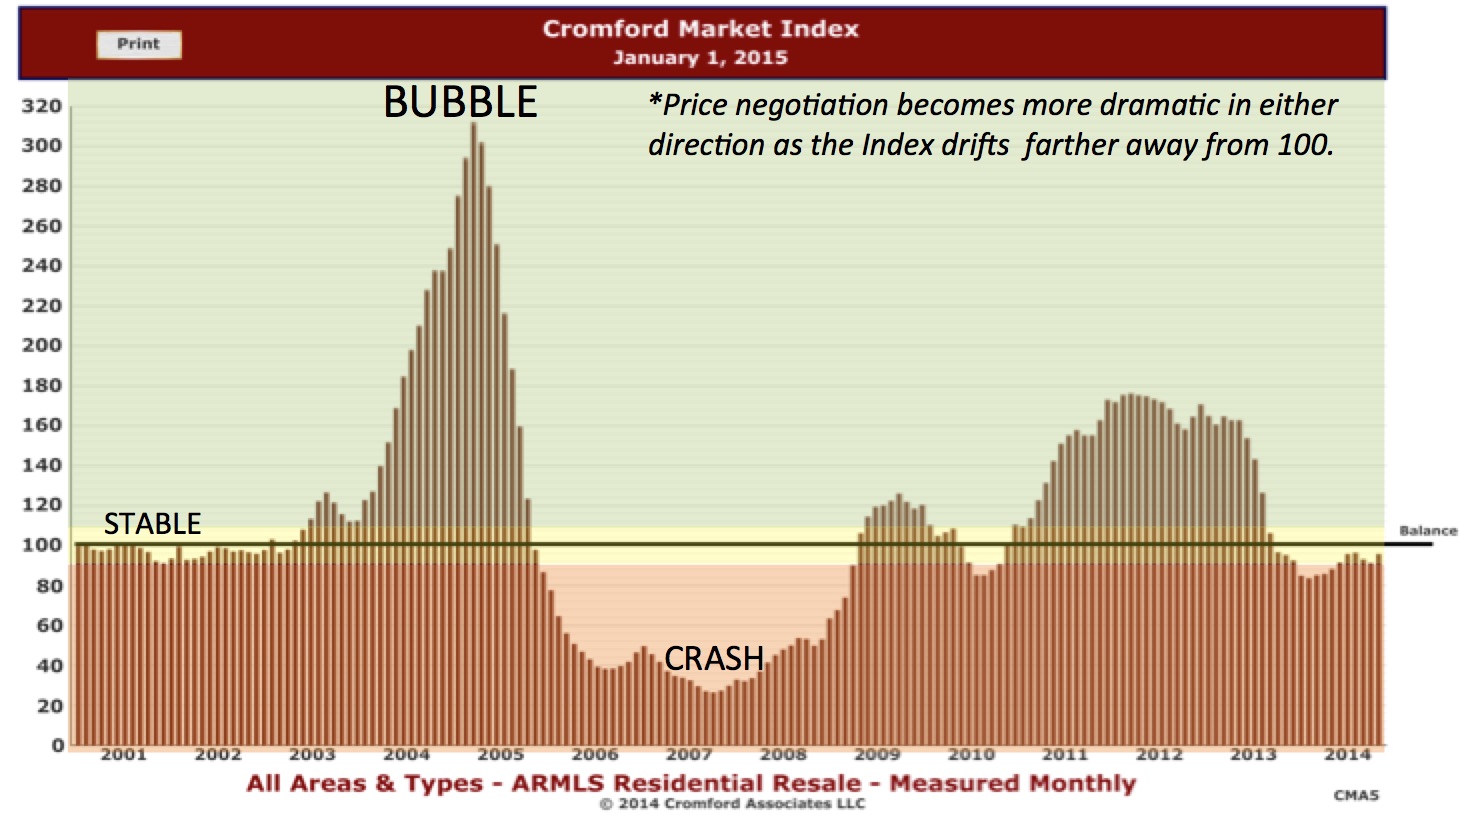
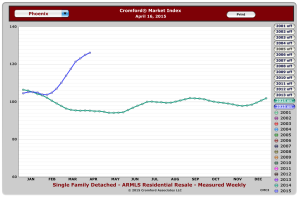
Index was showing that the market was turning toward a sellers’ advantage. I was shocked to see that trend taking an extreme swing upward.

To get a background on what the Cromford Index shows us, please see last month’s article.

So, what does this mean for you? If you are thinking to sell, then you are in a good position to do it now, before the summer might slow down this trend.

If you are thinking to purchase, then we need to talk strategy. What this means for you also depends on your specific situation and the neighborhood in which you live.

No doubt, this is a shifting market.

If you need help navigating it, please give me a call at 602-456-9388 and let’s assess the situation.

April 22, 2015by phxAdmin
Life, Market Analysis

Luxury Sales and Why You Should Care

Until I win that $50 million Powerball, I don’t expect to purchase a $3 million home.Mansion

Well, I probably would not, even then. And I know that most of my clients are not in the market.

That’s not to say that I can’t help you buy that luxury home, either.

So, why do I care about whether those are selling right now?

Well, because they are like a canary in a coal mine –albeit very LARGE canaries in a coal mine.

It is a positive economic indicator if luxury homes are on the market and if they are selling well. If the market is doing well at this range, it is a good bet that the market is doing well at the lower price ranges.

There are 32 listings over $3,000,000 that are under contract at the moment. This is the highest number we have seen since the housing boom. The average number since 2011 has been 10, and prior to March this year we had not seen any count higher than 20.

This data is brought to us from our friends at The Cromford Report.

Clearly the buyer interest in uber-luxury homes is very strong. Typically, “luxury” starts at about $1 million, depending on who you ask.

Whether you plan to buy $3 million luxury home, or a $100,000 home that is a luxury to you, it is best to know the data.

We can help. Call us at 602-456-9388.

April 15, 2015by phxAdmin
First Time Home Buyer, Live

New Home Buyer Assistance

1419Pecan-1I’m sure you’ve heard of home buyer programs over the years, programs that are funded by cities or counties and which help you buy your first home, if you qualify.

Folks ask me about them from time to time. And, while I’ve sold homes on these programs, I usually refer them to one of our mortgage broker friends for the latest updates. 

The reason is that the programs come and go faster than child stars on the Disney Channel.

Just this month, a new program was announced that would loan qualified home buyers up to $25,000 to be used as a down payment on a new home. This one is not run by the cities or counties, but by the private non-profit that has set aside $1 million to help low and moderate income families get in to a home.

NOTE: these are not grants, they are loans. So, in addition to the loan on the home, you will have to pay off the down payment loan over 15 years. To qualify – a family of four must make less than $51,000, and a single person make less than $35,850.

Two more notes of caution. First, be careful of anybody who offers you a loan on top of a loan. This organization seems to be a non-profit group that seems to be saying the right things. But, you should always look closely at all materials. Second, it may not be advisable to buy a home with little or no down payment. It is important to have “skin in the game.”

If you want to see a nice list of buyer assistance programs, check out Community Housing Resources of Arizona’s website. This may not be all of the options out there and I don’t personally endorse any in particular. But, they are out there. If you are willing to participate in the program, you may save a lot of money on your first home.

Please give me a call at 602-456-9388 for more information.

March 31, 2015by phxAdmin
Live, Market Analysis, Renting

What Does a Tight Rental Market Mean?

747 E. McKinley NewThe following is an excerpt from the Cromford Report’s comments from March 30th on the state of rentals in the Valley.

  • The situation with single family rentals continues to get even more extreme. Today there are just 1,763 active listings on ARMLS, down another 15% since the beginning of the month and down 25% from this time last year. This is 24 days of supply.
  • The average lease rate is up to $2,106 per month (up 41% from $1,710 last year). The average days on market is down to 33 (it was 40 last year).
  • There are 988 condo rentals active, down from 1,347 at the same time last year, which is a drop of 27%. This is 54 days of supply.
  • The average lease rate is up to $1,655 per month (up 13% from $1,461 last year). The average days on market is down to 39 (it was 45 last year).
  • Affordable homes to rent or buy are both becoming much harder to find. However there is still plenty of choice in the upper price ranges for both lease and purchase.

Now, the MLS is very powerful as a source of data for sales, but not so much for rentals. I’ve heard told that only about 50% of all rentals are represented on the MLS. Those tend to be the higher priced ones; not the ones that list on Craigslist.com.

Here’s a little more on the topic from an AZCentral.com article.

Still, this an alarming pattern. It means that there are a shrinking number of rental properties for families and individuals. This is also why cities are encouraging the building of new rental projects. See this post from last week, at least as pertains to downtown Phoenix.

Every problem presents an opportunity, however. If you are thinking of getting in to the investment market for rentals, now is the time to do it.

Please give me a call at 602-456-9388 if you’d like to build a strategy.

March 31, 2015by phxAdmin
First Time Home Buyer, Life, Market Analysis

The Seller’s Market is Coming

For those of you who are long-time readers, you know that I’m a fan of the Cromford Index. The index not only tells you whether we are in a seller’s market or a buyer’s market, but also by how much we are going one way or another.

If you are buying a home, you’ll want to watch this trend. If the Cromford Index is moving upward, you need to move before it goes too far in to the seller’s advantage.

If you are selling a home, you need to watch out for the opposite trend. If you see the index moving downward, then you want to be more aggressive in your pricing –get out ahead of the market so you are not chasing it downward.

So, where are we now? Check this out.Cromford Index 2015-03-26

Remember, 100 is a balanced market. Over 100 is a seller’s market and under is a buyer’s market.

See how much of a buyer’s market it was during the Great Recession? Then see how the seller’s took over from 2010 to 2014? Those were the people who bought during the lowest of the crash and then sold once we started to recover.

Notice also that we’ve been mostly riding 100 for a little while. Well, it looks like we are moving up towards a seller’s market once again. What does that mean? It means that sellers have an advantage — no seller-paid closing costs, prices will go up if supply stays low.

Combine this with the possibility that interest rates may go up later this year and you will want to get on in to the hunt today if you are a buyer.

If you are a seller, those interest rates are mixed news. Yep, the market seems to favor you, but an increase in interest rates may deter buyers. Or, it may encourage buyers to get in the market. We will see.

Check out this chart over just the last month. This market is definitely heating up. Cromford Index Table 2015-03-26
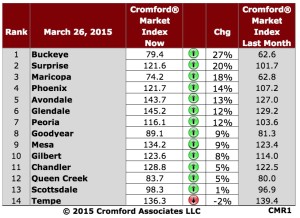
Just in the last month, the index for Phoenix has moved upward 14%. Only Tempe dropped.

What this means for you also depends on your specific situation and the neighborhood in which you live.

No doubt, this is a shifting market.

If you need help navigating it, please give me a call at 602-456-9388 and let’s assess the situation.

house3

March 31, 2015by phxAdmin
First Time Home Buyer, Live, Market Analysis

Gen Y Is Buying Now

1-8e78396072You’ve probably heard me lament about the fact that Generation Y home buyers are not coming in to the housing market as quickly as we had hoped.

The Cromford Report has addressed several times about the fact that Gen Y-ers are less likely to purchase homes right now –being saddled with an average of $25,000 of debt for an undergraduate education and having seen their parents lose homes in the Great Recession. In fact, much of  last year’s dip in first time homebuyer purchases (sub $200k) was attributed to sluggish Gen Y home purchases.

Well, I thought you’d find this report interesting. Basically, we are finding that the sheer size of the Gen Y generation may compensate for the fact that some are unable or unwilling to purchase a home right now.

Some other highlights:

  • Gen Y comprises the largest share of home buyers at 32 percent, which is larger than all Baby Boomers combined.
  • Gen Y also has the largest share of first-time buyers at 68 percent.
  • Thirteen percent of all buyers purchased a multi-generational home, one in which the home consists of adult children over the age of 18, and/or grandparents residing in the home
  • Among all generations of home buyers, the first step in the home buying process is looking online for properties for sale.

Just food for thought. If you are reading this post on your smart phone while simultaneously texting your friends and flipping between vines, this data might impact you more.

Getting the right house the first time you buy a home will set you on the right path for the rest of your life.

I can help. Call me at 602-456-9388.

March 19, 2015by phxAdmin
First Time Home Buyer, Live, Market Analysis

Fed. Signals Possible Rate Increase

I don’t want to give you heart palpitations, but if you are planning to purchase a home, you might want to do it sooner this year, rather than later.

The Federal Reserve Bank signaled this week that it will begin raising interest rates as soon as June, but they promise not to jack them up.

I’m pretty certain that “jack them up” is a term of art around the Fed.  

So, given the impending rate increases, let’s review how interest rates impact the price of your home. 

Let’s start with where we are now. Interest rates for most lenders for FHA and conventional loans are hovering around 4.0% APR. 

If, as a result of the Fed’s increase, we go to 5% (it probably won’t go that quickly, but its hard to say), then here is the difference:

$200,000 home at 4% APR, with 5% down payment on a 30-year fixed loan = $907, principle and interest only.

$200,000 home at 5% APR, with 5% down payment on a 30-year fixed loan = $1,019, principle and interest only.

That extra $112 per month is $1,344 per year or $40,320 over the life of the loan!

Another way to look at it: At 5%, paying $907 per month, you would only be able to afford a $178,000 home. 

Here’s the double whammy: Home prices are increasing at about 3% per year right now in Phoenix. Add that to your interest rate increase.

A year from now, that $200,000 home might be on the market for $206,000. 

And the beat goes on….

So, what does this mean? It means that you want to consider getting in to the market before interest rates go up.

 Give me a call. I’m more than happy to help you navigate the market: 602-456-9388.

March 19, 2015by phxAdmin
Live, Market Analysis

Graphs to Know and Love

Here are some graphs that tell me so much about where the market is right now, and where we can expect it to be for the next year. Thanks to my friends at the Cromford Report for this illuminating analysis. Click on each chart for a larger view.

Annual Sales-Longterm1) Annual Sales Rates — This chart tells the story of where this market has come from and where it is now. Notice that the number of sales per year peaked just before the Great Recession, crashed during the recession and climbed back over 2011 to late 2013. Most interesting, look at where it is now. We hit this point and now we are at a plateau. Is that bad? Nope. See the next chart.

Cromford Index-Longterm

2) Cromford Index Over the Long Term — This tells you where we are: equilibrium. If you look back at older posts, you will see that I talk a lot about the Cromford Index. This tells you not only whether we are in a buyer’s market or a seller’s market, but by how much.  If we are over 100, it is a seller’s market. If we are under 100, it is a buyer’s market. Notice that we are hovering just under 100, but just within reach. Notice also that it seems to be staying there, at just about the same time in history that is shown as that plateau in the chart above. So, what this means is that buyers and sellers have roughly the same amount of leverage. This means that we homes are selling, but not there is neither a rush to cash out nor a rush to hold. That’s a healthy market.

PricevPayment3) Price vs. Payment — So, why is this? Well, despite the lowering real income over time of the American family, the super-low interest rates are helping drive the real estate market. When you look at this chart, you can see that your monthly payment will get you much more house than it would back in 2008. So, affordability is much better right now. This, friends is the actual impact of low interest rates –in action. Yep. Its like an action movie.

Ave PPSF-Longterm4) Long-term Price Per Square Foot. — So, where are we going? As I’ve been telling clients, we are in a slow, healthy upward climb in home prices. If you look at this chart, you will see the 2% to 3% range of long-term growth in prices, shown in the grey shaded area. Notice that, after the recovery of 2011 to 2013, prices are skirting the lower range of that shaded area. So, no bubbles and no drops.

 What does this mean? It means that if you are buying, prices are sliding slowing upward, but your buying power is strong. If you are thinking about selling, you might as well do it now while buyers have more purchasing power. If you wait a year, the most you will gain on your sale (unless you do major renovations) will probably be about 2%. In other words, sell based on need, not on a desire to play the market.

As usual, I can help you make the right decision. Give me a call at 602-456-9388.

March 2, 2015by phxAdmin
Page 12 of 39« First...10«11121314»2030...Last »

Subscribe to Our Newsletter

We keep your data private and share your data only with third parties that make this service possible. Read our Privacy Policy.

Thank you! Please check your inbox or spam folder to confirm your subscription.

Categories

  • Art
  • Blogroll
  • Design
  • Editor's choice
  • Events General
  • Events GYP
  • Fashion
  • Featured
  • First Time Home Buyer
  • Homes
  • Life
  • Light Rail
  • Live
  • Market Analysis
  • NeighborhoodVideos
  • Phoenix News
  • Photography
  • Photoshootings
  • Profiles
  • Public Policy
  • Renovation
  • Renting
  • Restaurant Reviews
  • Sustainable Living
  • Tips
  • Uncategorized


© 2015 copyright GET YOUR PHX ® // All rights reserved // Privacy Policy