Get Your PHX - A Whole New Way to Experience Phoenix
  • Home
  • Our Blog
  • About Us
  • Contact
Get Your PHX - A Whole New Way to Experience Phoenix
Home
Our Blog
About Us
Contact
  • Home
  • Our Blog
  • About Us
  • Contact
Live, Market Analysis, Renting

What Does a Tight Rental Market Mean?

747 E. McKinley NewThe following is an excerpt from the Cromford Report’s comments from March 30th on the state of rentals in the Valley.

  • The situation with single family rentals continues to get even more extreme. Today there are just 1,763 active listings on ARMLS, down another 15% since the beginning of the month and down 25% from this time last year. This is 24 days of supply.
  • The average lease rate is up to $2,106 per month (up 41% from $1,710 last year). The average days on market is down to 33 (it was 40 last year).
  • There are 988 condo rentals active, down from 1,347 at the same time last year, which is a drop of 27%. This is 54 days of supply.
  • The average lease rate is up to $1,655 per month (up 13% from $1,461 last year). The average days on market is down to 39 (it was 45 last year).
  • Affordable homes to rent or buy are both becoming much harder to find. However there is still plenty of choice in the upper price ranges for both lease and purchase.

Now, the MLS is very powerful as a source of data for sales, but not so much for rentals. I’ve heard told that only about 50% of all rentals are represented on the MLS. Those tend to be the higher priced ones; not the ones that list on Craigslist.com.

Here’s a little more on the topic from an AZCentral.com article.

Still, this an alarming pattern. It means that there are a shrinking number of rental properties for families and individuals. This is also why cities are encouraging the building of new rental projects. See this post from last week, at least as pertains to downtown Phoenix.

Every problem presents an opportunity, however. If you are thinking of getting in to the investment market for rentals, now is the time to do it.

Please give me a call at 602-456-9388 if you’d like to build a strategy.

March 31, 2015by phxAdmin
First Time Home Buyer, Life, Market Analysis

The Seller’s Market is Coming

For those of you who are long-time readers, you know that I’m a fan of the Cromford Index. The index not only tells you whether we are in a seller’s market or a buyer’s market, but also by how much we are going one way or another.

If you are buying a home, you’ll want to watch this trend. If the Cromford Index is moving upward, you need to move before it goes too far in to the seller’s advantage.

If you are selling a home, you need to watch out for the opposite trend. If you see the index moving downward, then you want to be more aggressive in your pricing –get out ahead of the market so you are not chasing it downward.

So, where are we now? Check this out.Cromford Index 2015-03-26

Remember, 100 is a balanced market. Over 100 is a seller’s market and under is a buyer’s market.

See how much of a buyer’s market it was during the Great Recession? Then see how the seller’s took over from 2010 to 2014? Those were the people who bought during the lowest of the crash and then sold once we started to recover.

Notice also that we’ve been mostly riding 100 for a little while. Well, it looks like we are moving up towards a seller’s market once again. What does that mean? It means that sellers have an advantage — no seller-paid closing costs, prices will go up if supply stays low.

Combine this with the possibility that interest rates may go up later this year and you will want to get on in to the hunt today if you are a buyer.

If you are a seller, those interest rates are mixed news. Yep, the market seems to favor you, but an increase in interest rates may deter buyers. Or, it may encourage buyers to get in the market. We will see.

Check out this chart over just the last month. This market is definitely heating up. Cromford Index Table 2015-03-26
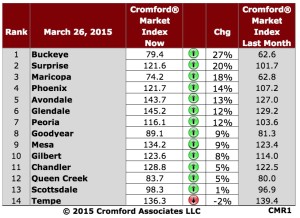
Just in the last month, the index for Phoenix has moved upward 14%. Only Tempe dropped.

What this means for you also depends on your specific situation and the neighborhood in which you live.

No doubt, this is a shifting market.

If you need help navigating it, please give me a call at 602-456-9388 and let’s assess the situation.

house3

March 31, 2015by phxAdmin
First Time Home Buyer, Live, Market Analysis

Gen Y Is Buying Now

1-8e78396072You’ve probably heard me lament about the fact that Generation Y home buyers are not coming in to the housing market as quickly as we had hoped.

The Cromford Report has addressed several times about the fact that Gen Y-ers are less likely to purchase homes right now –being saddled with an average of $25,000 of debt for an undergraduate education and having seen their parents lose homes in the Great Recession. In fact, much of  last year’s dip in first time homebuyer purchases (sub $200k) was attributed to sluggish Gen Y home purchases.

Well, I thought you’d find this report interesting. Basically, we are finding that the sheer size of the Gen Y generation may compensate for the fact that some are unable or unwilling to purchase a home right now.

Some other highlights:

  • Gen Y comprises the largest share of home buyers at 32 percent, which is larger than all Baby Boomers combined.
  • Gen Y also has the largest share of first-time buyers at 68 percent.
  • Thirteen percent of all buyers purchased a multi-generational home, one in which the home consists of adult children over the age of 18, and/or grandparents residing in the home
  • Among all generations of home buyers, the first step in the home buying process is looking online for properties for sale.

Just food for thought. If you are reading this post on your smart phone while simultaneously texting your friends and flipping between vines, this data might impact you more.

Getting the right house the first time you buy a home will set you on the right path for the rest of your life.

I can help. Call me at 602-456-9388.

March 19, 2015by phxAdmin
First Time Home Buyer, Live, Market Analysis

Fed. Signals Possible Rate Increase

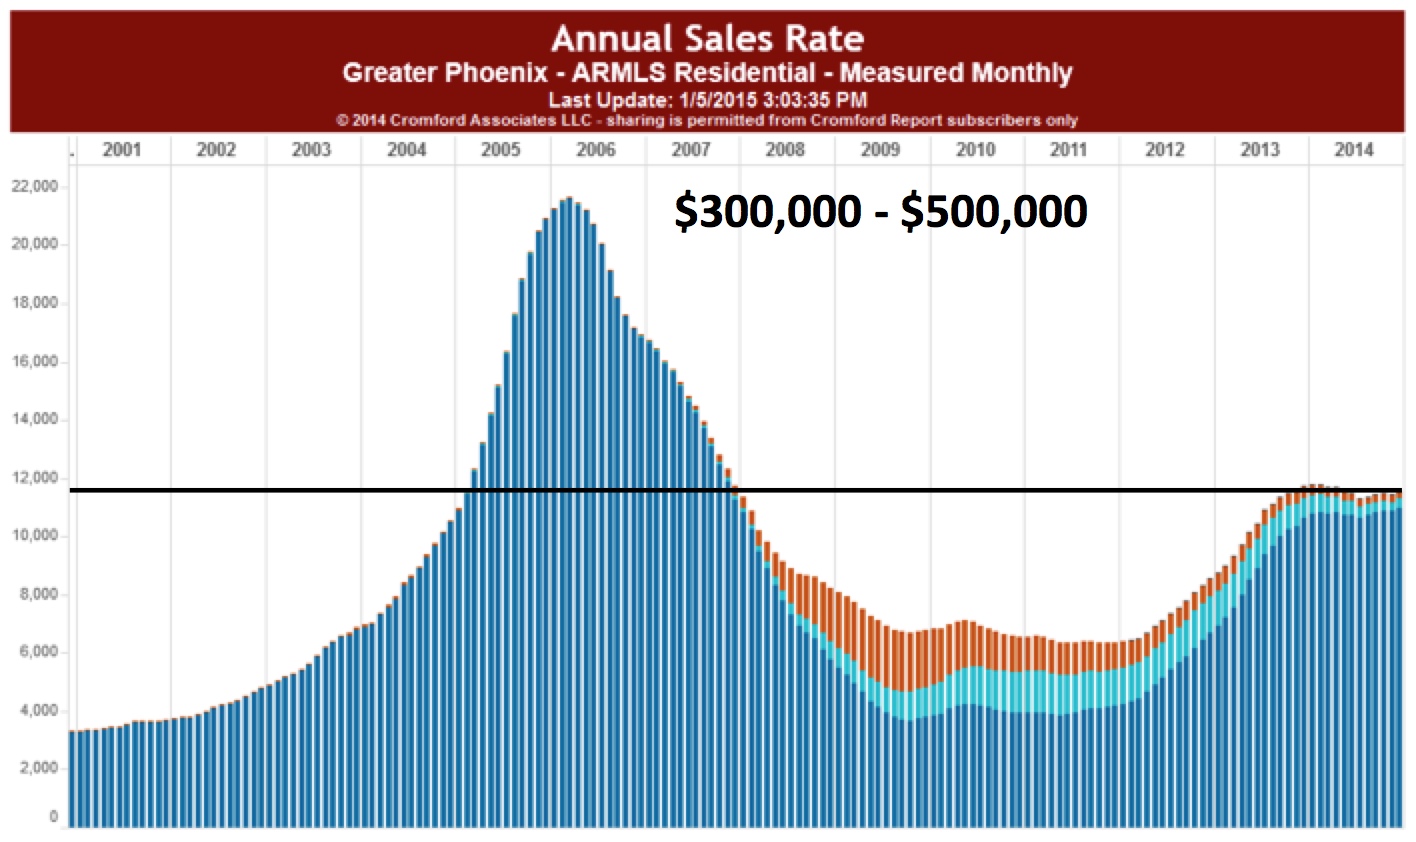
I don’t want to give you heart palpitations, but if you are planning to purchase a home, you might want to do it sooner this year, rather than later.

The Federal Reserve Bank signaled this week that it will begin raising interest rates as soon as June, but they promise not to jack them up.

I’m pretty certain that “jack them up” is a term of art around the Fed.  

So, given the impending rate increases, let’s review how interest rates impact the price of your home. 

Let’s start with where we are now. Interest rates for most lenders for FHA and conventional loans are hovering around 4.0% APR. 

If, as a result of the Fed’s increase, we go to 5% (it probably won’t go that quickly, but its hard to say), then here is the difference:

$200,000 home at 4% APR, with 5% down payment on a 30-year fixed loan = $907, principle and interest only.

$200,000 home at 5% APR, with 5% down payment on a 30-year fixed loan = $1,019, principle and interest only.

That extra $112 per month is $1,344 per year or $40,320 over the life of the loan!

Another way to look at it: At 5%, paying $907 per month, you would only be able to afford a $178,000 home. 

Here’s the double whammy: Home prices are increasing at about 3% per year right now in Phoenix. Add that to your interest rate increase.

A year from now, that $200,000 home might be on the market for $206,000. 

And the beat goes on….

So, what does this mean? It means that you want to consider getting in to the market before interest rates go up.

 Give me a call. I’m more than happy to help you navigate the market: 602-456-9388.

March 19, 2015by phxAdmin
Live, Market Analysis

Graphs to Know and Love

Here are some graphs that tell me so much about where the market is right now, and where we can expect it to be for the next year. Thanks to my friends at the Cromford Report for this illuminating analysis. Click on each chart for a larger view.

Annual Sales-Longterm1) Annual Sales Rates — This chart tells the story of where this market has come from and where it is now. Notice that the number of sales per year peaked just before the Great Recession, crashed during the recession and climbed back over 2011 to late 2013. Most interesting, look at where it is now. We hit this point and now we are at a plateau. Is that bad? Nope. See the next chart.

Cromford Index-Longterm

2) Cromford Index Over the Long Term — This tells you where we are: equilibrium. If you look back at older posts, you will see that I talk a lot about the Cromford Index. This tells you not only whether we are in a buyer’s market or a seller’s market, but by how much.  If we are over 100, it is a seller’s market. If we are under 100, it is a buyer’s market. Notice that we are hovering just under 100, but just within reach. Notice also that it seems to be staying there, at just about the same time in history that is shown as that plateau in the chart above. So, what this means is that buyers and sellers have roughly the same amount of leverage. This means that we homes are selling, but not there is neither a rush to cash out nor a rush to hold. That’s a healthy market.

PricevPayment3) Price vs. Payment — So, why is this? Well, despite the lowering real income over time of the American family, the super-low interest rates are helping drive the real estate market. When you look at this chart, you can see that your monthly payment will get you much more house than it would back in 2008. So, affordability is much better right now. This, friends is the actual impact of low interest rates –in action. Yep. Its like an action movie.

Ave PPSF-Longterm4) Long-term Price Per Square Foot. — So, where are we going? As I’ve been telling clients, we are in a slow, healthy upward climb in home prices. If you look at this chart, you will see the 2% to 3% range of long-term growth in prices, shown in the grey shaded area. Notice that, after the recovery of 2011 to 2013, prices are skirting the lower range of that shaded area. So, no bubbles and no drops.

 What does this mean? It means that if you are buying, prices are sliding slowing upward, but your buying power is strong. If you are thinking about selling, you might as well do it now while buyers have more purchasing power. If you wait a year, the most you will gain on your sale (unless you do major renovations) will probably be about 2%. In other words, sell based on need, not on a desire to play the market.

As usual, I can help you make the right decision. Give me a call at 602-456-9388.

March 2, 2015by phxAdmin
Live, Market Analysis

Density and Development

Phoenix

 I got a peek recently at a list of multi-family projects that are in “pre-development” or current development stages in downtown Phoenix.

It was an interesting thing to see that the list accounted for about 2,000 rental units that should be completed in downtown by the end of 2016, but only about 360 owner-occupied units, to be completed in the same time period.

There is a rough proportion of rentals to owner-occupied units that one would expect in any area, but I was surprised to see the proportion at about 6 rental units for every 1 owner-occupied unit.

There ares several dynamics here.

First, the city of Phoenix is very eager to get “rooftops” built downtown as an economic development tool. They seem to want to provide housing for rent in order to provide for the growing student population, more than they are driven by owner-occupied units.

Second, “millennials” seem to be less inclined to purchase home. After all, they saw their parents and family lose homes during the Great Recession. Who need that, right? Further, with an average of $24,000 of debt coming out of Arizona undergraduate institutions alone, these folks don’t have the borrowing capacity.

Third, we still have some properties (I’m looking at you 44 Monroe) that were once owner-occupied, but which are now rentals. Maybe they will come back to owner-occupied in the future.

I get all of this, but there is a part of me that is concerned. You don’t have to buy in to the “great American real estate” dream that your home is an investment to know that you need a good mix of owner-occupied in any community. Owning a home means that the occupants are more likely to feel a connection to the neighborhood, to get involved in block watch and neighborhood associations.

Don’t get me wrong. I don’t think that renters are too transient to care about their neighborhoods, as some do.

But, color me a little skeptical that it is a good idea over the long term to have six times as many rental units as there will be owner-occupied units downtown.

That is all. Talk among yourselves. I’d be interested to hear your thoughts.

March 2, 2015by phxAdmin
Live, Market Analysis

The Ups and Downs

The market so far this year has exhibited some odd, maybe even contradictory, behavior.

The question is, what do you do in this situation?

Here are some cases-in-point from our friends at The Cromford Report.

Screen Shot 2015-02-09 at 8.34.02 AM

1) The beginning of 2015 so far has been disappointing for sellers. We can tell you that its been tough for ours. The listings are beautiful and well-priced. But the buyers continue to sit on the fence. The only thing to do is wait and continue marketing the listings. See below for a break-down of cities and whether they are a buyer’s market or a seller’s market. The Cromford Index shows this –if the index is over 100, it is a seller’s market. Under 100 is a buyer’s market.

2) Interest rates are even lower. I spoke with one of our favorite lenders last week who told me that he was seeing 30-yr fixed rates consistently under 4%. That’s like free money almost! This will definitely prime the pump.

3) FHA financing has just gotten less expensive. This means that the sector of the market that uses FHA financing (low to moderately-priced homes) can now afford financing again. According to Mike Orr at Cromford, “The reduced mortgage insurance premiums for FHA loans are having a significant effect according to the Mortgage Bankers Association (MBA). The biggest change affected FHA refinance applications which rose 76.5% for the week ending January 30.” That’s a huge leap in activity!

4) Over-all, the market is a bit better now than it was last year. Its very similar, but a smidgen better. Again, Cromford:

“From the normal snapshot as of February 8, we can pick out the following improvements for sellers over the last 12 months:

  • Active Listings (excluding UCB) – down 5% from 22,872 to 21,750
  • UCB Listings – up 38% from 1,825 to 2,519
  • Pending Listings – up 14% from 4,404 to 5,036
  • Days of Inventory – down from 138 to 132
  • Months of Supply – down from 6.1 to 5.6 months
  • Contract Ratio – up from 27.2 to 34.7″

What this tells me is that buyers and sellers are uncertain. The data would say that it is a good time to make a move, but most people don’t see the data.

The advice I have for this situation is that every market has opportunities, even the worse markets. The challenge is to know how to take advantage of those opportunities. Give us a call and we can help you make a plan. 602-456-9388.

February 9, 2015by phxAdmin
Live, Market Analysis

Feb 2015 Forecast

If you read this blog much, you probably have a lot of time on your hands and a high threshold for eye-glazing data.

You also probably know that I am a fan-boy of The Cromford Report. Why? Because they are more often correct than any others I’ve seen –and that benefits the clients who are wise enough to work with our team (hint, hint).

Case in point, their predictions last month were spot on regarding where we would be this month. To quote CR,  “(AvePPSF-Hist-SFR&Condo-$75-$1milf)or the monthly period ending January 15, we are currently recording a sales $/SF of $130.38 averaged for all areas and types … This is 0.7% below the $131.28 we now measure for December 15 and represents a small slide in average pricing, as expected. Our forecast range was $127.10 to $132.28 with a mid-point of $129.69. Last month’s forecast proved reasonable and the actual result was only slightly above the mid-point of our predicted range.”

I like to compare their county-wide averages to the Historic Trend Line that I often report on. That is condos and single family residents in zip codes dominated by historic neighborhoods, non-distressed and between $75k and $1 million.

I found it interesting that the historic trend line dropped very slightly, while the over-all bumped slightly upward. Cromford folks think all of this is generally a state of equilibrium (balance of sales and purchases), and that’s a good place to be.

The question is whether this is significant. Historic homes tend to out-perform “regular” homes. So, while the price per square foot is $6 higher, above, the trend line is going the other direction.

7150-Front

Click to see our sweet, sweet listings.

I think it is too soon to tell. My gut tells me that these prices will start moving upward again as we get away from the Super Bowl and in to the high market months (February through June). Also, I heard of lending rates at around 3.8% for a 30-yr fixed loan. That’s incredible and jealousy-inducing for me, personally (’cause I want that rate!). More importantly, it will probably pump the market.

Cromford is expecting an average monthly sales $/SF on February 15 to be $131.77, which is 1.7% higher than the January 15 reading.  This follows a pattern which is common in most years where a stronger February follows a weak January after a strong December.

A little more from Cromford:  “We are seeing stronger sales counts in the first half of January than we did in January 2014, 7% higher year to date. However pending listing counts and under contract counts are showing no improvement over last year so our enthusiasm is tempered.”

This tracks with what I am seeing in historic, with some listings sitting on the market for much longer than they should.

They finalize by saying that there is no cause for prices to fall except in a few small areas with excessive local supply.

What does this mean in the Queen’s English? I dunno. But in American English it means that prices are stable, interest rates are so low its almost like free money and that you should jump now if you are thinking of buying.

If you need to sell, the interest rates will help you motivate buyers and the prices are still better than they’ve been in years –just don’t expect strong up-ward pressure any time soon.

Give me a call if you need to make the big jump and we can build a strategy around your specific needs. 602-456-9388.

January 31, 2015by phxAdmin
First Time Home Buyer, Live, Market Analysis

What is “Listing Success Rate”?

I want to introduce you to a measure that we use to see how the market is doing in terms of sales.

“Listing success rate” is the percent of homes that, once listed, sell. Specifically, they do not expire or the sellers do not cancel the listings. This is a great way to see whether the market is stronger or weaker for sellers. When we see a big shift either way, we may be able to see where the trend is going.

Here’s the listing success rate this month.Listing Success Rate-Phoenix

Pretty dramatic decline, huh? So, does this mean that you should not list your home?

You know I’m going to say “no”, right?

There are two factors to consider here.

First, in the words of The Cromford Report’s market guru, Mike Orr, “Overall the listing success rate is down to 60.5%, which happens to be very close to the 14 year long term average of 60.7%. It is slightly improved from January 26, 2014 when we saw 60.0%, but not by enough to be able to claim any significance.

In other words, it is a matter of perspective. If you first started thinking about listings in most of 2013 or June of 2014, this rate does not look too good to you. But, we are right on the long-term averages for this market.

Second, this is a city-wide rate. If we could break this down to zip code (which is tough because the data sets become very small at that point), you would probably see that listing success rates vary in different areas. The historic neighborhoods and CenPho tend to do better, if you are priced right.

That brings us back to the quality of the work that your realtor does. Yep. You guessed it. This is the part where I say that you should call me if you are thinking of listing your home. We can dig deeper in to these numbers and create a strategy for you to succeed. Call me at 602-456-9388!

January 30, 2015by phxAdmin
First Time Home Buyer, Live, Market Analysis

Skip the Big Banks, Please – Part 1

For years I’ve been advising my clients to avoid the Big Banks and credit unions like a fly in your guacamole.

Don’t get me wrong. I’ll do my banking any day at a credit union over some national bank. In fact, I did move all of my banking from some Big Bank™ to a local credit union. As you can learn from Local First Arizona, the more we support locally owned businesses, the more we help our economy. Further, the big national banks don’t deserve our business, after tossing our economy off a cliff like a sad rag doll.

But, when it comes to loans, I can only go on my experience. And I have found that you will always do better with a mortgage broker than a Big Bank. If I really, really had to rank them, I’d go with a local credit union before any national bank. At least with a local credit union, you can elevate a problem to somebody higher up than some sad bank worker in a broom closet.

Still, from time to time our clients insist on using their Big Bank, even after our warnings. So, I want to take this time to express to all five of you who read this blog some of the intractable problems with the Big Banks.

First, a myth. Just because you bank with a company, does not mean you will get the best terms. If you take the deal offered to you by a Big Bank to a mortgage broker, you will probably find out that you will get a better deal. And, if you don’t get a better deal at first, it is only because the Big Bank has not yet had an opportunity to change the terms just in time for close due to some unforeseen circumstance. (Yes, this has happened enough times for me to feel comfortable leveling this charge.)

Second, another myth. Some folks think that if they go with their Big Bank, the bank will hold that loan and not sell it. Thus, you will get to keep all of your business in one place. While many Big Banks will continue to house their loans, there is a very good chance that your loan will be sold off.

Yes, mortgage brokers will sell off your loan. While that is annoying, it is not the end of the world. Its not like the Big Banks are really that good at customer service, anyway.

Problem #1: Bank employees are not typically as qualified as mortgage brokers, in my experience. When we have found a person at a Big Bank who is really smart and committed, we usually see what their own bank bureaucracy puts them through and we certain that they are probably quietly filling out a resume to leave this job to work for a mortgage broker. Many employees are not given a monetary incentive to do a better job. They work for salary, not a good commission.

Problem #2: The really big banks often split the loan and transaction process up in to little bits on a conveyor belt, so that one poor person is just dealing with one part all day, over and over again. They don’t have pull with the underwriters to solve problems and they can’t even see the entire process from where they sit.

Problem #3: Bureaucracy. These banks are so big that you have to spend ages on a phone tree and sometimes you don’t talk to the same person who actually knows you. This is true both during the home-buying process and afterwards.

Problem #4: Attitude. I will illustrate this with a couple recent stories next week. But, by and large, the attitude of the Big Banks is that you and I need them. They don’t need us. Can you blame them? This is the message that they got loud and clear when we bent over backwards to keep them from splitting apart (as they should have done) during the Great Recession.

For now, I need to take a deep breath and do some yoga. If you want to see the second installment of this tirade, have a look here.**


**NOTE: My friend Jeannie Bolger from Nova Home Loans added the following to clarify that loan officers with banks and credit unions don’t have to be licensed to help you with you loan.

“Bank and Credit Union LO’s are not required to be licensed – they are registered, but not Licensed.  They did not have to pass a State and Federal test to get the ability to originate a loan.  Nor are they required to take licensing hours each year like your and me to stay up to date on the guidelines and once again pass a test to show you are competent to continue to originate a loan.
 
The banks and CU’s lobbied to be “Waived” from having their employees licensed mainly due to the fact they have the call centers and none of those people could have passed the Federal and State test.  It’s expensive and the banks did not want to take on that expense and because they are so powerful they won!!!
 
So basically, I’m held to a higher standard because I am licensed and I have no problem with that.  Just know when you go to a Bank or Credit Union the Loan officer your speaking to is not necessarily Licensed and did not have to pass an Arizona or a National test to originate loans.  They could have been a shoe salesman at Macy’s 2 weeks prior.  Buyer be aware!!!!”

December 1, 2014by phxAdmin
Page 9 of 25« First...«891011»20...Last »

Subscribe to Our Newsletter

We keep your data private and share your data only with third parties that make this service possible. Read our Privacy Policy.

Thank you! Please check your inbox or spam folder to confirm your subscription.

Categories

  • Art
  • Blogroll
  • Design
  • Editor's choice
  • Events General
  • Events GYP
  • Fashion
  • Featured
  • First Time Home Buyer
  • Homes
  • Life
  • Light Rail
  • Live
  • Market Analysis
  • NeighborhoodVideos
  • Phoenix News
  • Photography
  • Photoshootings
  • Profiles
  • Public Policy
  • Renovation
  • Renting
  • Restaurant Reviews
  • Sustainable Living
  • Tips
  • Uncategorized


© 2015 copyright GET YOUR PHX ® // All rights reserved // Privacy Policy