Get Your PHX - A Whole New Way to Experience Phoenix
  • Home
  • Our Blog
  • About Us
  • Contact
Get Your PHX - A Whole New Way to Experience Phoenix
Home
Our Blog
About Us
Contact
  • Home
  • Our Blog
  • About Us
  • Contact
Live, Market Analysis

Days on Market – CenPho

Our friends at the Cromford Report did a little analysis recently of days on market (DOM) over the last 90 days. They showed zip code 85004 with an incredibly low DOM, at 19.

To quote:

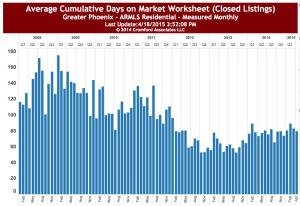
Today we look at those zip codes with the lowest Average Cumulative Days on Market for sales of Single Family Residences sold in the last 90 days since June 21st, 2015.

All of the zip codes depicted in the map below had an average CDOM of less than 60 days. The CDOM is the count of days from the time a listing goes active in the MLS to when the status is changed to Pending (not UCB). Many people are placing their listings in UCB status instead of Pending in order to continue marketing them on sites such as Zillow. The UCB status keeps the CDOM counting, while Pending will stop the count. As a result of this behavior, many of our “Fastest Selling” zip codes show a higher CDOM measurement than one might expect. In fact, many of the listings in these areas saw an accepted contract within hours of going active.

Screen Shot 2015-06-26 at 11.48.45 AM


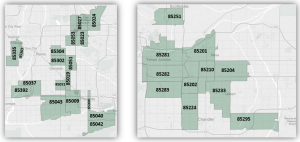
Area                                       Zip Code          Avg CDOM for SFR sales last 90 days
Central Phoenix                  85004                19
South Phoenix                    85040                 32.9
El Mirage                             85335                 40.7
West Phoenix                     85027                  42.1
South Phoenix                    85009                  45.5
Youngtown                         85363                  46.6
West Phoenix                    85053                   47.3
West Phoenix                    85019                   47.6
Tempe                                 85282                  48.4
West Phoenix                    85037                   49.1
West Phoenix                    85031                   49.4
Mesa                                    85210                  49.4
Glendale                            85304                   50.7
Mesa                                   85202                  52.1
Chandler                            85224                  53.1
Mesa                                   85201                   53.7
Gilbert                                85233                  55.1
Avondale                            85392                 55.2
West Phoenix                    85023                 55.3
Glendale                             85302                 56.8
Tempe                                 85283                 57.1
North Phoenix                   85024                 57.3
South Phoenix                   85042                 57.5
Mesa                                    85204                57.5
Gilbert                                 85295                58.6
Tempe                                 85281                 58.9
West Phoenix                     85051                59.2
Scottsdale                           85251                 59.4
South Phoenix                   85043                59.5

But, that 85004 zip code really seems like an outlier for some reason. If you look at the zip codes that primarily house the historic neighborhoods in CenPho, the picture looks more like this:

Screen Shot 2015-06-26 at 11.51.13 AM  
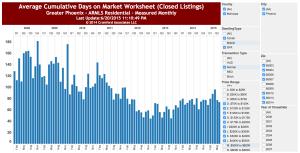
While the number jumped in March, they are generally dropping and hovering around 80 days. Part of this is because, as Cromford said, the way agents classify UBC vs. Pending changes the count. But also I think it is true that homes even in the popular CenPho and historic areas are on the market for this long. Sometimes the sellers list too high, thinking they will get more than they can. Sometimes people over-value a home that needs renovation.

Regardless, if inventories don’t increase, we can expect average days on market to decrease in CenPho.

If you need help building a strategy for your purchase, please give me a call at 602-456-9388. We specialize in this area and we can help you make the right move.


June 26, 2015by phxAdmin
Live, Market Analysis

June 2015 Market Update

Here are some take-aways as we enter the June market, from our friends at the Cromford Report:

1) May continued to be a good time to be a seller in most areas & price ranges.

2) Demand quickly recovered from well below normal in January to slightly above normal by mid April and it has stayed there throughout May.

Front2_1308_E_Georgia_SALE_02

3) Meanwhile supply continues to drop for an ever-widening collection of areas & price ranges, giving plenty of problems for most buyers who are bumping into each other at the few listings that remain. Multiple offer situations are increasing.

4) If buyers are wanting to spend more than $500,000 then they are in luck – supply is much more plentiful above that mark, though a few very popular areas like Arcadia have relatively slim pickings.  During May even those upper price ranges saw a downward trend in active listing counts, but not enough to cause any real problems for most buyers.

5) If today’s normal demand can cause supply to drop as much as it did in the last month, then buyers are going to have an even harder time if demand were to grow.

6) This market is particularly brutal for the entry level market, which is desperately short of homes for sale or rent.

More points:
Active Listings: 20,351 versus 25,555 last year – down 20.4% – and down 5.4% from 21,512 last month.

Pending Listings: 7,819 versus 6,965 last year – up 12.3% – but down 1.7% from 7,951 last month.

Under Contract Listings: 12,063 versus 10,360 last year – up 16.4% – but down 1.7% from 12,276 last month.

Monthly Sales: 8,293 versus 7,509 last year – up 10.4% – but down 2.3% from 8,490 last month.

Monthly Average Sales Price per Sq. Ft.: $136.19 versus $127.65 last year – up 6.7% – and up 0.5% from $135.45 last month.

Monthly Median Sales Price: $211,000 versus $192,500 last year – up 9.6% – and up 4.5% from $202,000 last month

This increase in sales prices over last year is more acute in historic areas from what I’ve seen anecdotally.

The Cromford Index seems to be flattening out a little bit, as I would expect in the summer. This means the degree to which it is a seller’s market is just not increasing as quickly as it was in April. It is still a solid seller’s market.

Cromford Index 2015-06-09

June 9, 2015by phxAdmin
First Time Home Buyer, Live, Market Analysis

More on Not Trusting Zillow

wizard pst

I was driving down the road yesterday, minding my own business, when another ad for Zillow came on the radio.

They claimed that their service helps you compare prices, find rentals and maybe even train your cat to dance the polka. I might be wrong on that last point, but it sounded like he was saying that.

But, it brought me all back to the various reasons why Zillow is not necessarily your friend when it comes to buying or selling a home.

Here, here, here and here are four posts that I’ve done since 2011 which give you good details on what is wrong with this and other services like them. After hearing these ads, I feel obliged to educate the world.

1) Zillow and other services make money by selling ad space to realtors, to show up just at that moment you are looking at a nice home on their website. The agents who purchase your data may not be specialists in your area or the type of home you want. This is particularly important in historic areas.

2) The data that these services use comes from the data that we agents update every day, but these services don’t get all of that data. We reserve the most important (and most private) for our professional industry and for our clients. So, you may log on to these services, give them your data to use, but you won’t necessarily get the most up-to-date information.

3) There is a time delay from when we agents update listings (active, pending, closed) and when the services see the change. So, if you need to react quickly to the market, you may not be able to.

4) The data also impacts the estimates that you get from these sites. These services don’t get the most accurate data, so they have to construct some other estimate using older information, extrapolations and duct tape. They often give you an inaccurate picture of your home value, or the home you are looking at. This is especially true with historic homes.

If you want accurate statistical market analysis, specialty in the market and personalized representation, just call and agent so that you can use his or her MLS portal.

I can help you, so call me at 602-456-9388.


June 9, 2015by phxAdmin
First Time Home Buyer, Live, Market Analysis

May 2015 Market Forecast

Ave PPSF-MonthlyOur friends at the Cromford Report are predicting a slight decrease in prices across the valley in June, over May.

But, first, we saw impressive price increases since March.

“For the monthly period ending May 15, we are currently recording a sales $/SF of $136.34 averaged for all areas and types across the ARMLS database. This is 2.2% above the $133.42 we now measure for April 15 and represents the second month in a row with a significant increase in average pricing.”

Cromford folks are predicting a small correction for June. This makes intuitive sense to me, as the market slows a little bit going in to the summer months. Of course, that is anecdotal.

“Our mid-point forecast for the average monthly sales $/SF on June 15 is $134.54, which is 1.3% lower than the May 15 reading. We have a 90% confidence that it will fall within ± 2% of this mid point, i.e. in the range $131.85 to $137.23. Our forecast this month is therefore for a small correction after strong moves higher in sales pricing over the last two months.”

The interesting thing to think about for me will be whether we maintain this tight market of homes through the summer in the CenPho and historic neighborhoods.

Normally, I would assume that there will be downward pressure on prices in the summer, as there are often fewer buyers around. However, Michelle and I have been working hard with our clients to find the right properties, given the tight supply. So, that might carry over as some folks are still looking for the right house.

Also in the CenPho area, I expect some folks to list their homes, having seen how prices have gone up.

And, of course, don’t forget that many people want to get their house closed before the interest rates go up later this year.

What do you think will happen?

If you need help navigating this market, let me know at 602-456-9388.

May 27, 2015by phxAdmin
Live, Market Analysis

Where are the Foreclosures?

The old days at the county court house foreclosure auctions.

The old days at the county court house foreclosure auctions.

Somebody asked me the other day where all of the foreclosure deals went.

“Away,” I said.

We are now at or below normal levels for foreclosures. Its an interesting thing and amazing how time flies.

Our friends at the Cromford Report had an interesting quick analysis of where we are in comparison to other states. Here’s an excerpt:

“The Black Knight Financial Services Mortgage Monitor Report for March 2015 shows a sharp reduction in home loan delinquency for Arizona. The percentage of first loans with a late payment but not in foreclosure has dropped to 3.3% from 3.9% in February. The percentage of first loans in foreclosure remains at 0.6%, a level which has remained constant since May 2014. We can see the improving trend by examining the percentage of loans with a late payment but not in foreclosure for the last 6 months of March:

    •    March 2010 = 11.3%
    •    March 2011 = 8.6%
    •    March 2012 = 6.1%
    •    March 2013 = 4.9%
    •    March 2014 = 3.8%
    •    March 2015 = 3.3%

Arizona ranks 38 out of 50 states for delinquency pre-foreclosure, 45 out of 50 for loans in foreclosure and 42 out of 50 for overall non-current loans.

Black Knight Financial Services estimates that 9.6% of Arizona loans are underwater. This is the highest level for any state west of the Mississippi except for Nevada which is estimated at 16.4%. However there are still plenty of eastern states with higher levels:

    1.    Florida = 15.1%
    2.    Maryland = 14.0%
    3.    Illinois = 13.7%
    4.    New Jersey = 13.7%
    5.    Rhode Island = 13.5%
    6.    Connecticut = 12.3%
    7.    Ohio = 12.0%
    8.    Delaware = 11.4%
    9.    Michigan = 10.8%
    10.    Georgia = 10.8%
    11.    Wisconsin = 9.8%

Arizona’s loan delinquency is now well below the long term average, but negative equity remains a problem for about 1 in 10 borrowers.”

So, if you are thinking of finding distressed properties, we are back to the days when you had to be on the inside with banks so you can get those lists when they take the homes back.

I cut my teeth as a realtor on foreclosures and short sales. I have strong teeth.

Call me if you have any questions about the market today. We are here to help. 602-456-9388.

May 14, 2015by phxAdmin
First Time Home Buyer, Live, Market Analysis

Landlords and Llamas

7150-FrontThis post follows on a post that I did back in March, in which I discussed that there is such a tight rental market right now. Surprisingly enough, it was called “What Does a Tight Rental Market Mean?” I’m clever that way.

So, our friends at the Cromford Report have added an interesting thought to this conversation the lack of supply of entry-level homes:

“The most obvious source of new supply would be the large number of homes that are currently owned by landlords and used as rentals. However vacancy rates are low, rents are rising and these landlords would probably buy more properties if they could rather than sell them off. There are remarkably few new homes being built below $200K and if this situation persists, it is going to remain a very competitive struggle for buyers. Prices are likely to rise faster than earnings. This is good for current homeowners but bad for those currently renting and wanting to get started in home ownership. This could become even more of a problem if mortgage interest rates rise, adding to affordability problems for the first time home buyer.”

To put it another way, those folks who bought when the market was low and created cash-flow rentals have no incentive to sell. They are making money!

Unfortunately, this is shutting a lot of moderate-income buyers out of the market. It may be worse when interest rates begin to rise again at the end of this year.

So, if you are thinking of buying and if you are in this range, we need to talk! Call me at 602-456-9388.

Oh, and why “llamas” in the title? Well, I like alliteration.

May 14, 2015by phxAdmin
Live, Market Analysis

May’s Market Status

Our friends at the Cromford Report are always great about allowing us to share their analysis. As an agent, their information really gives me an edge that will benefit you.

Here’s are some highlights from they have to say about why we have seen a sudden shift to a seller’s market:

April continued the trends we saw in March with significant improvement in demand and volumes, though different price ranges are experiencing very different supply dynamics.

Currently the supply situation is the most important thing to watch and this is what determines how much competition buyers will experience.

Here are the basic ARMLS numbers for May 1, 2015 relative to May 1, 2014 for all areas & types:
    •    Active Listings (excluding UCB): 21,512 versus 26,205 last year – down 17.9% – and down 3.5% from 22,303 last month
    •    Pending Listings: 7,951 versus 7,199 last year – up 10.4% – and up 1.2% from 7,853 last month
    •    Monthly Sales: 8,363 versus 7,572 last year – up 10.4% – and up 6.0% from 7,887 last month
    •    Monthly Average Sales Price per Sq. Ft.: $135.88 versus $130.27 last year – up 4.3% – and up 2.9% from $131.99 last month
    •    Monthly Median Sales Price: $202,000 versus $190,000 last year – up 6.3% – and up 1.0% from $200,000 last month

From a seller’s perspective there is a lot of encouragement in this batch of numbers, though buyers might be dismayed to see price per sq. ft. rise by almost 3% in a single month.

For the sub-$200K price bands we are seeing mostly unexceptional demand, but exceptionally low supply, which is leading to multiple offer situations and strong upward price pressure.

As we move upmarket from $250K, things become a little easier for buyers because supply is less scarce. Once we get above $400K there are more active listings than last year and most buyers are having a much easier time with less competition from other buyers. In other words, demand is good but supply is plentiful at these higher price points.

Personally, I would add my own analysis here to mention that homes in the historic areas and CenPho tend to command higher prices than most areas. So, our experience with our clients right now shows that this tightness in supply goes up closer to $300k. In other words, it is difficult to get offers in quickly enough for nice listings in historic areas, even at the higher prices.

If you are thinking of buying or selling, please give me a call and I’ll help you put a strategy together, which takes these trends in to account. Call me at 602-456-9388.

May 14, 2015by phxAdmin
Live, Market Analysis

Average Days on Market April 2015

If you want a good measure of which direction the market is going, take a tip form our friends at the Cromford Report: watch how many days it takes on average for homes to sell.

From Cromford:

“April 20 – There is one “average days on market” measure that is actually quite useful but almost nobody measures. This is the average number of days on market for pending listings. We can interpret it as follows:

For all areas & types the following guidelines apply

  • under 60 means a very hot market
  • 60- 70 means a hot market
  • 70-80 means a warm market
  • 80-90 means a balanced market
  • 90-110 means a cool market
  • over 110 means a very cold market

The absolute number is probably less useful than the trend. When the number is falling, the market is improving and when it is rising it is deteriorating (from a sellers perspective).”

Ave Days on Market-2015-04

So, have a look at this chart, showing average days on market for the zip codes which house the major historic neighborhoods, plus much of central, north central and downtown corridors.

The first three months of the year show a distinct drop in days on market. The over-all condition is much lower than it was just four years ago. But, this current trend tracks with what I was seeing in my last post about the seller’s advantage we are seeing right now.

If you need help navigating what all of this means and applying it to your personal situation, please give me a call at 602-456-9388.

April 22, 2015by phxAdmin
Live, Market Analysis

Seller’s Advantage is Here

Last month, I pointed out that the Cromford Cromford Index 2015-04-22
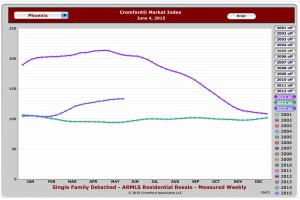
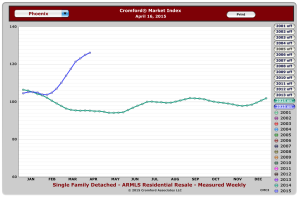
Index was showing that the market was turning toward a sellers’ advantage. I was shocked to see that trend taking an extreme swing upward.

To get a background on what the Cromford Index shows us, please see last month’s article.

So, what does this mean for you? If you are thinking to sell, then you are in a good position to do it now, before the summer might slow down this trend.

If you are thinking to purchase, then we need to talk strategy. What this means for you also depends on your specific situation and the neighborhood in which you live.

No doubt, this is a shifting market.

If you need help navigating it, please give me a call at 602-456-9388 and let’s assess the situation.

April 22, 2015by phxAdmin
Life, Market Analysis

Luxury Sales and Why You Should Care

Until I win that $50 million Powerball, I don’t expect to purchase a $3 million home.Mansion

Well, I probably would not, even then. And I know that most of my clients are not in the market.

That’s not to say that I can’t help you buy that luxury home, either.

So, why do I care about whether those are selling right now?

Well, because they are like a canary in a coal mine –albeit very LARGE canaries in a coal mine.

It is a positive economic indicator if luxury homes are on the market and if they are selling well. If the market is doing well at this range, it is a good bet that the market is doing well at the lower price ranges.

There are 32 listings over $3,000,000 that are under contract at the moment. This is the highest number we have seen since the housing boom. The average number since 2011 has been 10, and prior to March this year we had not seen any count higher than 20.

This data is brought to us from our friends at The Cromford Report.

Clearly the buyer interest in uber-luxury homes is very strong. Typically, “luxury” starts at about $1 million, depending on who you ask.

Whether you plan to buy $3 million luxury home, or a $100,000 home that is a luxury to you, it is best to know the data.

We can help. Call us at 602-456-9388.

April 15, 2015by phxAdmin
Page 8 of 25« First...«78910»20...Last »

Subscribe to Our Newsletter

We keep your data private and share your data only with third parties that make this service possible. Read our Privacy Policy.

Thank you! Please check your inbox or spam folder to confirm your subscription.

Categories

  • Art
  • Blogroll
  • Design
  • Editor's choice
  • Events General
  • Events GYP
  • Fashion
  • Featured
  • First Time Home Buyer
  • Homes
  • Life
  • Light Rail
  • Live
  • Market Analysis
  • NeighborhoodVideos
  • Phoenix News
  • Photography
  • Photoshootings
  • Profiles
  • Public Policy
  • Renovation
  • Renting
  • Restaurant Reviews
  • Sustainable Living
  • Tips
  • Uncategorized


© 2015 copyright GET YOUR PHX ® // All rights reserved // Privacy Policy