Get Your PHX - A Whole New Way to Experience Phoenix
  • Home
  • Our Blog
  • About Us
  • Contact
Get Your PHX - A Whole New Way to Experience Phoenix
Home
Our Blog
About Us
Contact
  • Home
  • Our Blog
  • About Us
  • Contact
First Time Home Buyer, Live, Market Analysis

Central Phoenix Market Update

We’ve been seeing some shifting in the central Phoenix market recently, so I figured we might check in early with the Cromford Report for a Central Phoenix Market Update.

Anecdotally, we’ve seen listings starting to sell more quickly. We expect that as we go in to the high season for home sales –February through June.

Active Listings Central Phoenix Feb 2016

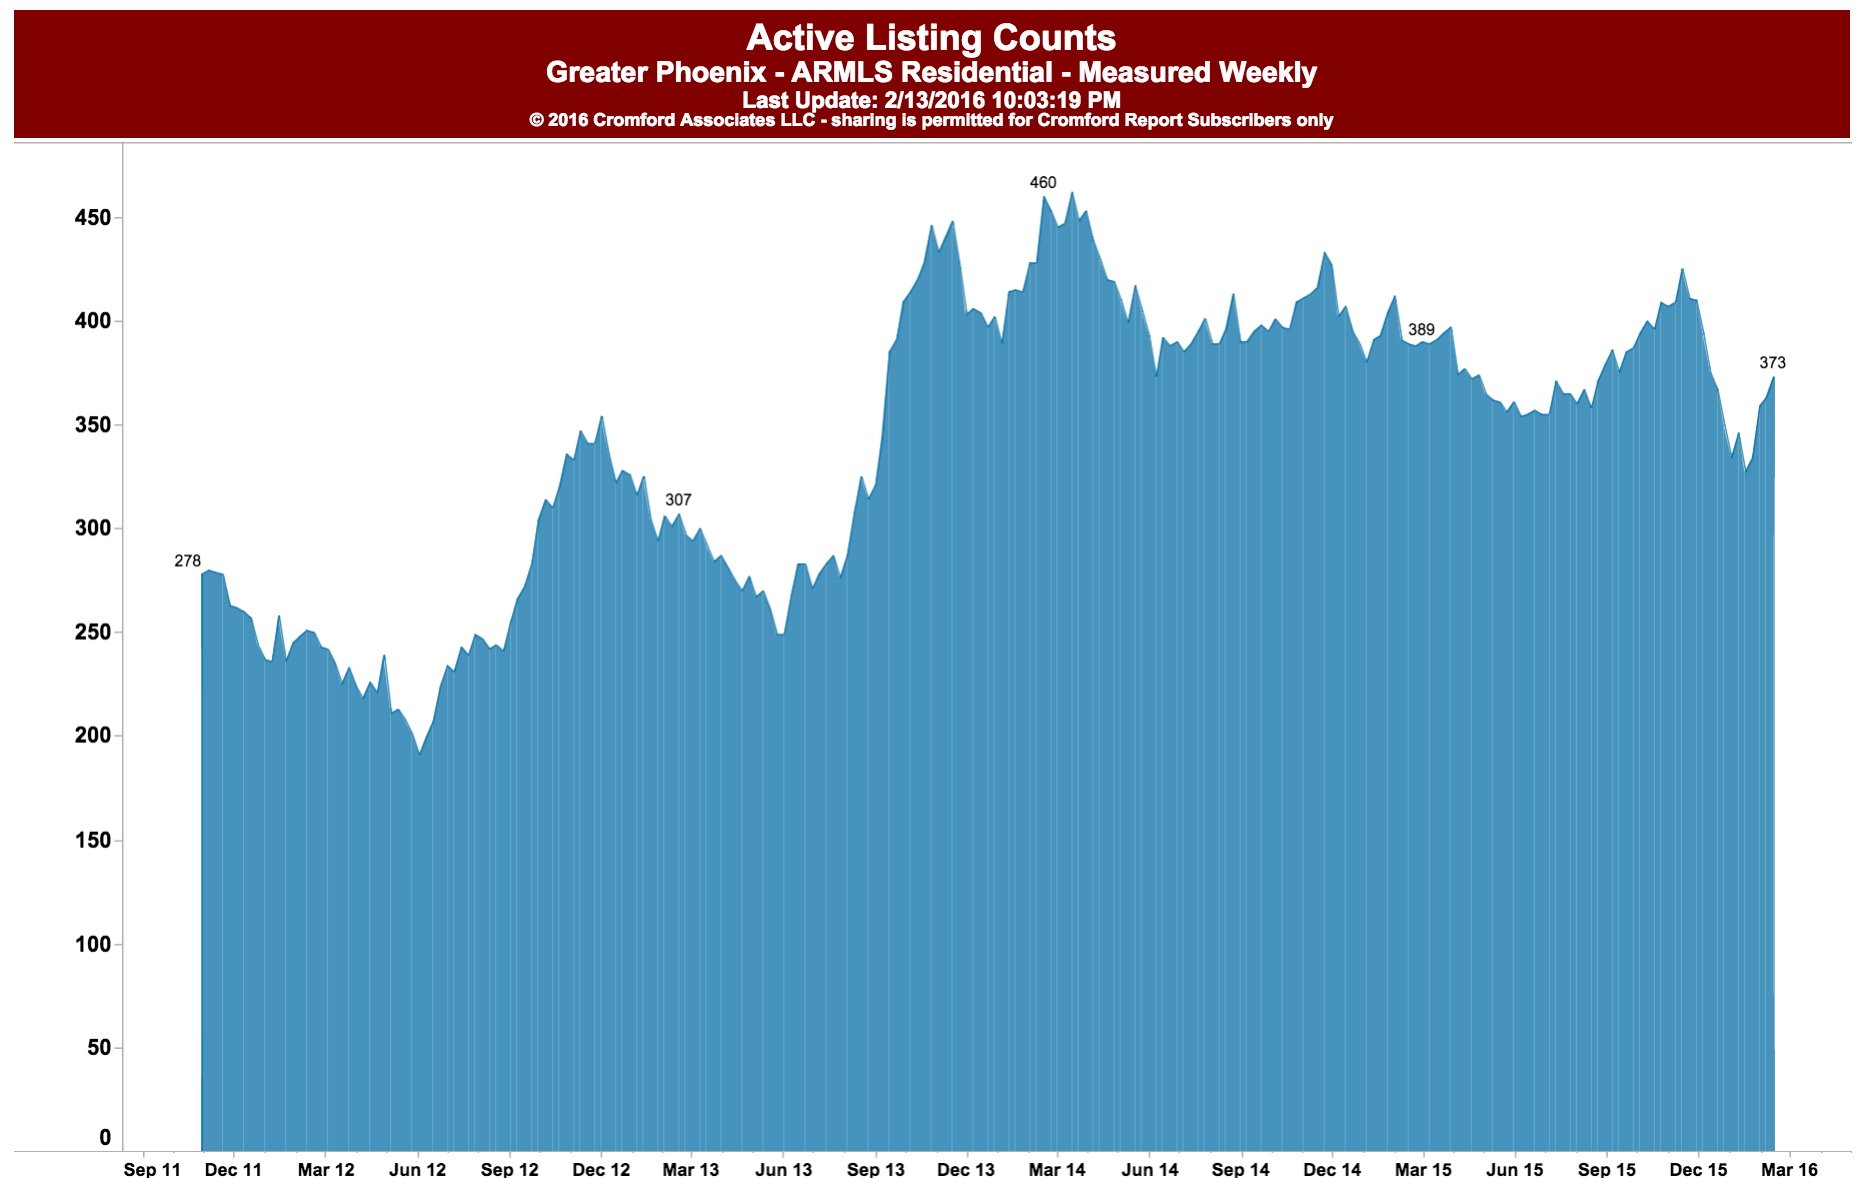
Central Phoenix Active Listings

The end of 2015 was a little slow for our folks listing properties. It was to the point where we were advising prospective sellers to hold off and watch. We are seeing better activity, so we are encouraging those folks to list now, rather than later.

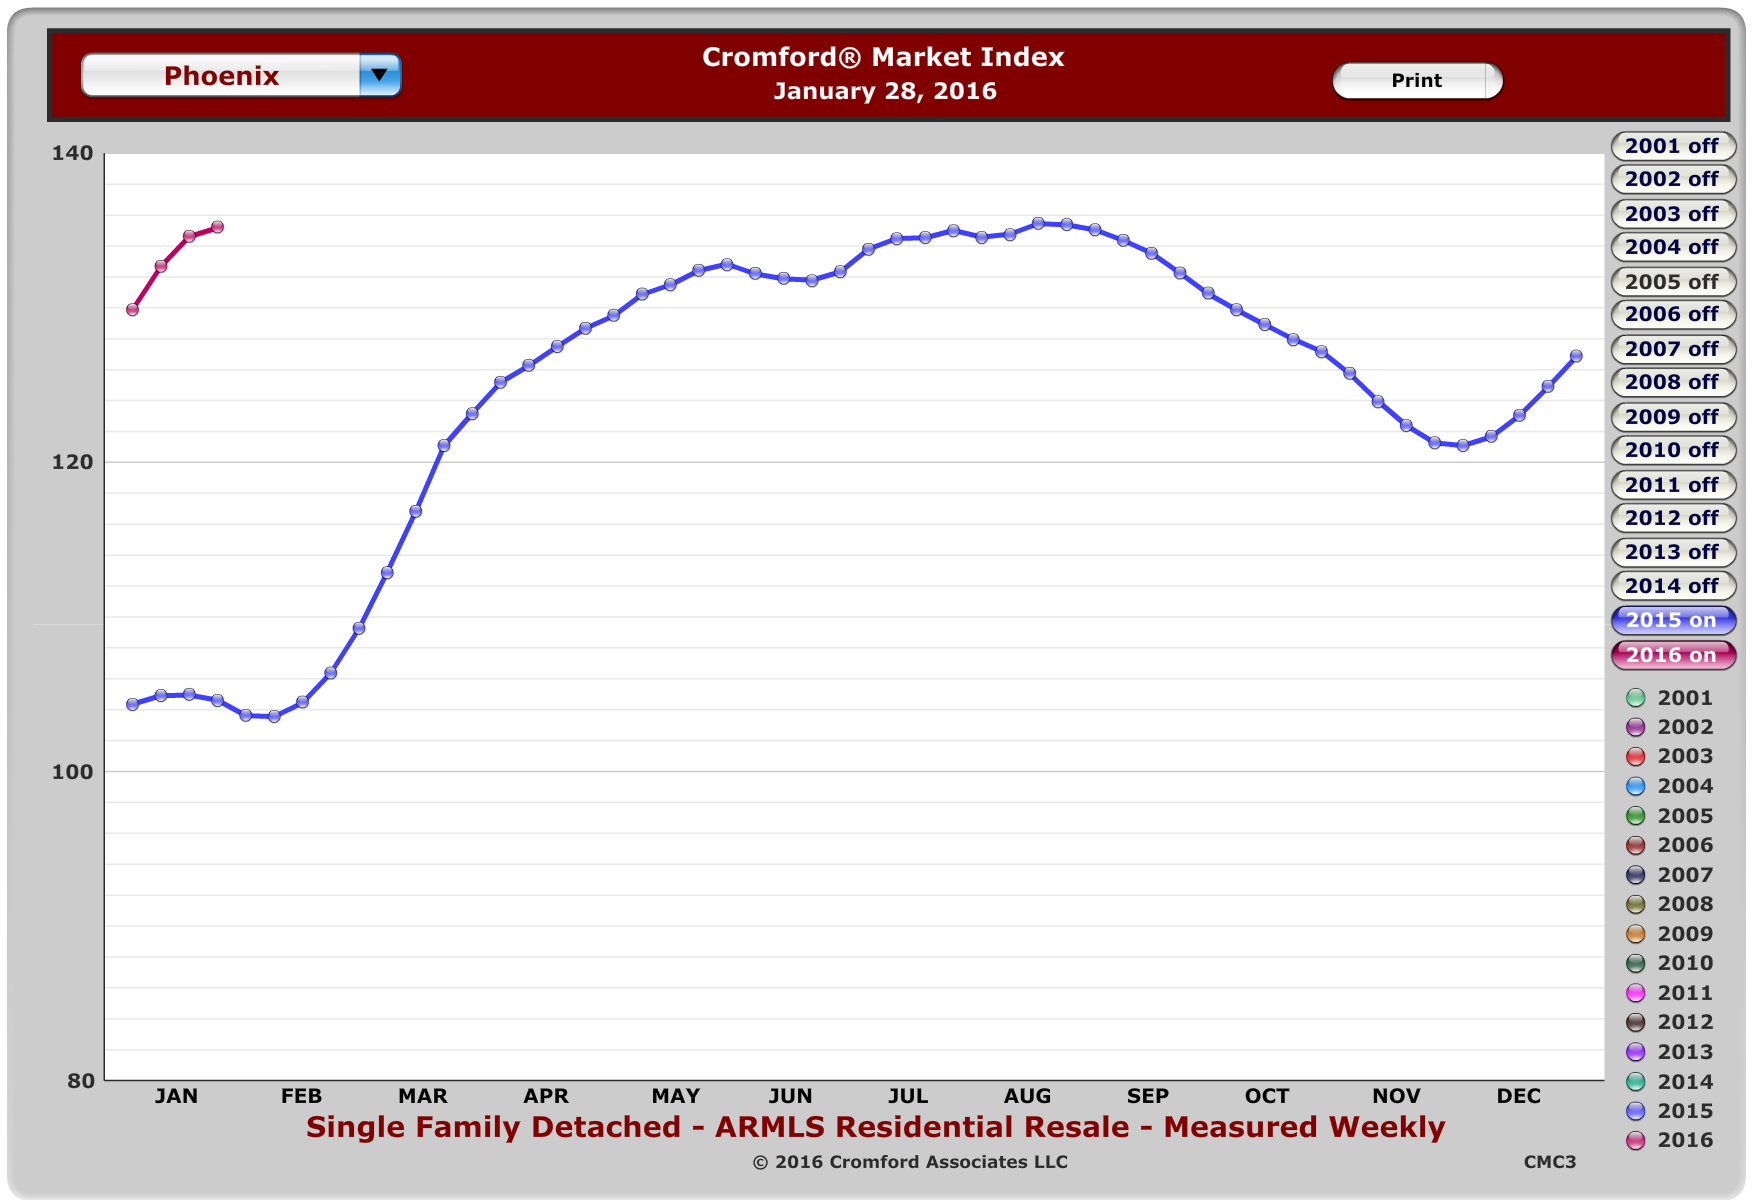
Cromford confirms what we are seeing in our central phoenix market update. See how the active listings in CenPho zip codes dropped quickly at the end of last year, but they are rebounding now.

What I find interesting is how the Cromford Index responds quickly to that. We see that little dip in the pink line on the index. That corresponds to the increased number of listings –the greater the number of listings, the less of a seller’s market it is.

Cromford Index Feb 2016
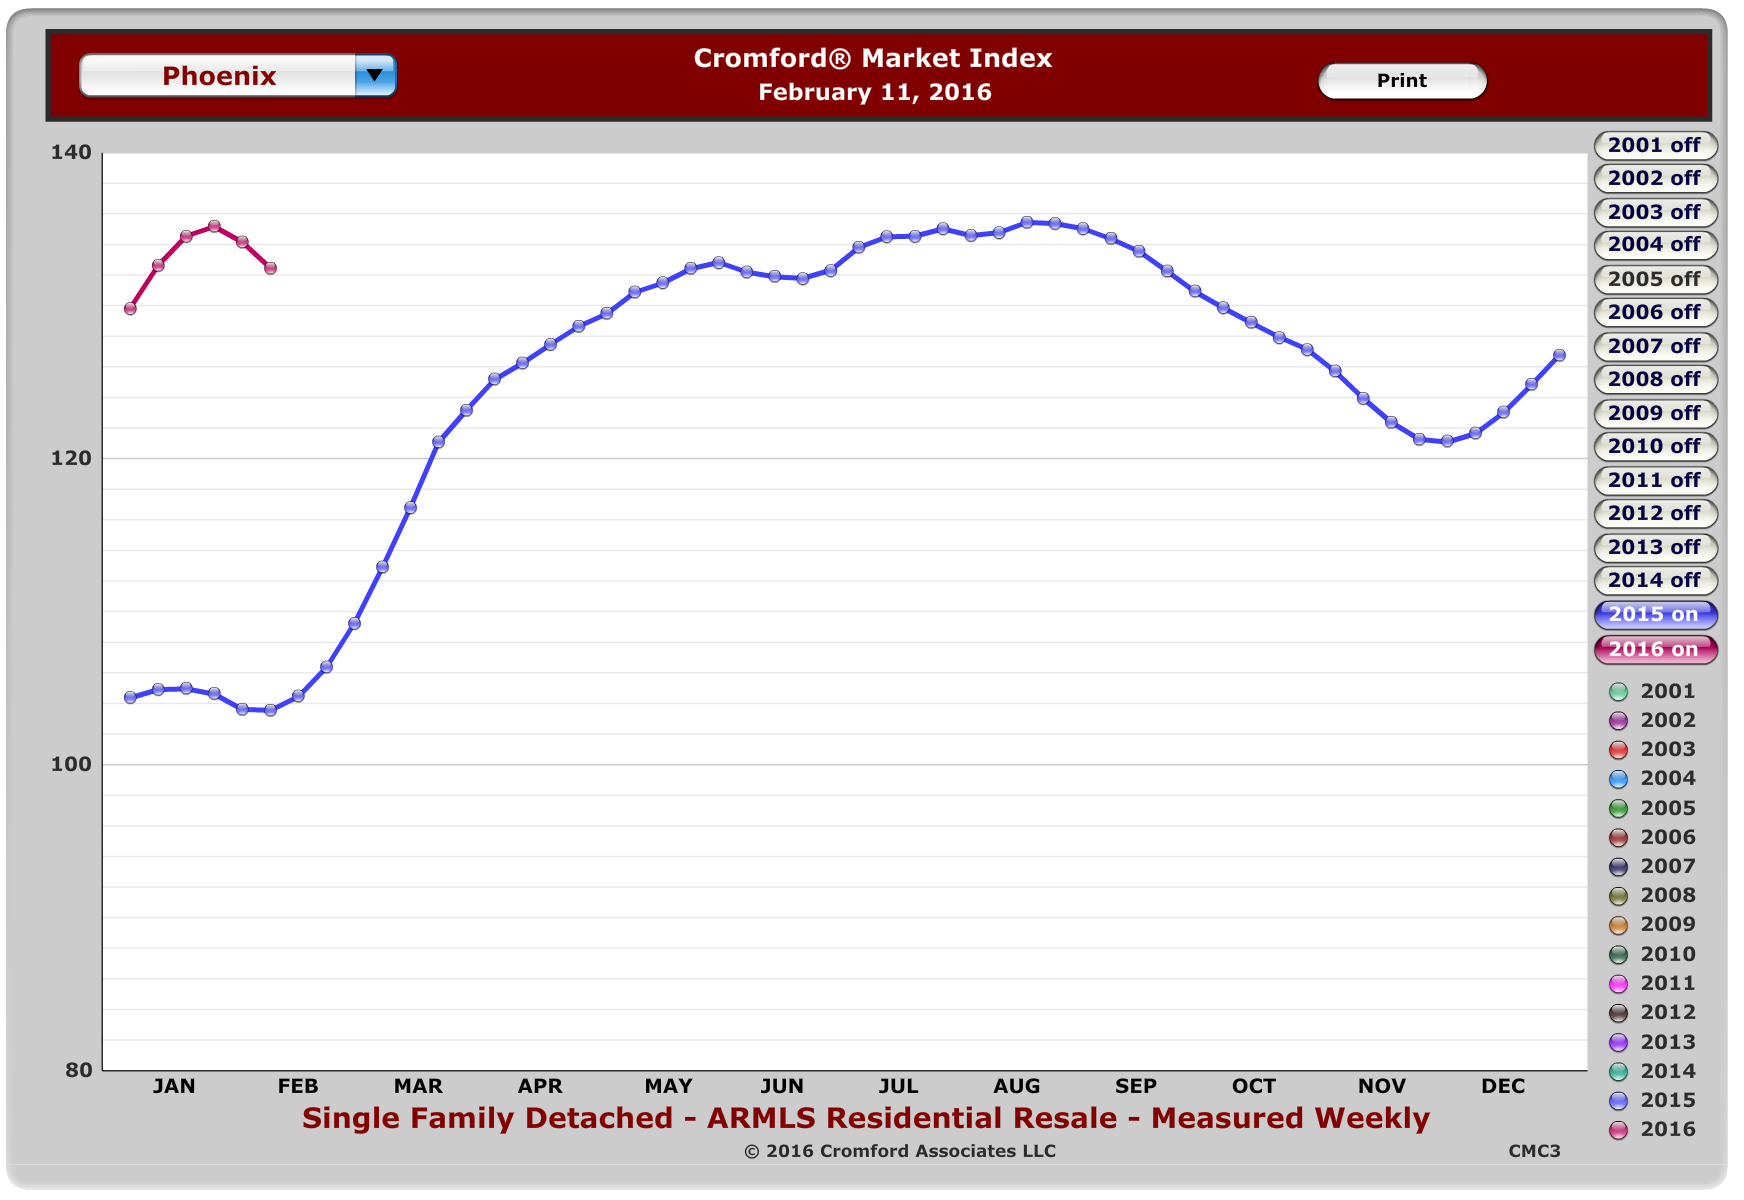
To be precise, there are a lot of factors that go in to the Cromford Index. It is proprietary, so I don’t know all of them. But some have been explained to me, and inventory is one of them.

Regardless, and despite the small drop, I find it interesting that we are still at a higher point on the index that almost any time last year.

So, what does that mean? Well, I take it to mean that if folks continue to list, we could see a turn in the Cromford Index. However, if the preponderance of people listing get a little greedy and price above market, then sales of well-priced homes will continue to be robust.

If you need help building a strategy around your sale or purchase, please contact us at 602-456-9388.

You refer, we donate. Call me today to find out how we can support your favorite charity. We appreciate your referrals!

February 18, 2016by phxAdmin
Blogroll, Live, Market Analysis

January Phoenix Market Update

Here’s your January Phoenix Market Update. Our friends at the Cromford Report are showing a very slight increase in sold price over December.

January Phoenix Market Update

Price per square foot – Phoenix

“For the monthly period ending January 15, we are currently recording a sales $/SF of $138.24 averaged for all areas and types across the ARMLS database. This is very little changed from the $138.32 we now measure for December 15.

On January 15 the pending listings for all areas & types shows an average list $/SF of $142.04, 0.7% above the reading for December 15. Among those pending listings we have 88.0% normal, 4.6% in REOs and 7.3% in short sales and pre-foreclosures. This has changed little from this time last month.

So we are not expecting a lot of movement between January and February, although any direction is more likely to be to the upside.”

Anecdotally, Michelle and I were seeing sellers staying on the market a little longer in December, and sold prices coming in a little lower than list price. But, that’s to be expected around the holidays.

January Phoenix Market Update

Seller’s vs. Buyer’s Market?

We are in a bit of a waiting period right now in the CenPho area. Will the market get active, as it usually does between February and July? Or, will we see a continuation of the slacking seller’s market from December?

If you are a seller, price realistically. We discourage “going fishing” –listing at a high price, hoping somebody will pay higher than market value. That usually leads to people passing up your listing for more attractively priced homes –then your listing goes stale.

Buyers, don’t be afraid to offer what the market shows to be reality, but don’t expect price drops. The seller’s market is went a little slack, but it is still in seller’s market range (according to the Cromford Index).

As always, please give us a call for any of your real estate needs at 602-456-9388.

February 2, 2016by phxAdmin
First Time Home Buyer, Live, Market Analysis

November Market Update

The cooling trend that started gently in August has now developed more momentum. Supply is still growing faster than it did last year while demand continues to show a slow weakening trend. Things are getting better for buyers and worse for sellers.

It remains a seller’s market in most areas where properties can be easily found for the median sales price of $213,000 or less. Elsewhere we are dropping towards a balanced market and one or two areas have retreated to a level where buyers have a small advantage.

The Cromford® Market Index moved from around the 144 mark at the beginning of October to around the 134 mark at the beginning of November (all cities). This has now become a significant enough change for most people to feel a difference. More sellers are becoming frustrated, especially those in those with the highest growth in active listings and relatively weak demand.

We’ve advised our clients to price competitively. If you are thinking about selling, let’s talk about how to build a strategy. It is easy to believe that a seller’s market might return in January, after the holidays. But, previous years indicate that this may not always be the case.

Call me at 602-456-9388 for more information.

Cromford Index 2015-10-29

November 3, 2015by phxAdmin
First Time Home Buyer, Live, Market Analysis

October Market Update

Cromford Index 2015-10-01

September developed a bit of a cooling trend, as compared to earlier in the year with a very strong seller’s market. Supply has started to grow and demand weakened slightly again. This is not really a major market development like we saw around this time two years ago, but it might be considered mildly disappointing for those rooting for the market to go from strength to strength.

It remains a seller’s market overall. The Cromford® Market Index moved from around the 148 mark at the beginning of August to around the 144 mark at the beginning of October, reversing the gains in August. This is not enough change for my friends at the Index to predict a major change.  But it is fair to say that market balance moved to give seller’s slightly less of an advantage in most areas.

Here are the basic ARMLS numbers for October 1, 2015 relative to October 1, 2014 for all areas & types:
    •    Active Listings (excluding UCB): 20,024 versus 23,514 last year – down 14.8% – but up 4.8% from 19,101 last month
    •    Active Listings (including UCB): 23,238 versus 26,336 last year – down 11.8% – but up 3.7% compared with 22,413 last month
    •    Pending Listings: 5,789 versus 5,481 last year – up 5.6% – but down 7.5% from 6,259 last month
    •    Under Contract Listings (including Pending & UCB): 9,003 versus 8,303 last year – up 8.4% – but down 5.9% from 9,571 last month
    •    Monthly Sales: 6,966 versus 6,230 last year – up 11.8% – but down 0.9% from 7,100 last month
    •    Monthly Average Sales Price per Sq. Ft.: $133.24 versus $126.82 last year – up 5.1% – but up 0.7% from $132.26 last month
    •    Monthly Median Sales Price: $211,000 versus $195,000 last year – up 8.2% – but up 1.4% from $208,000 last month

–Source. Cromfordreport.com

October 6, 2015by phxAdmin
First Time Home Buyer, Live, Market Analysis

Household Formation and Our Market

The Cromford Report folks track household formation to see how many new buyers are coming on the market.

Household formation
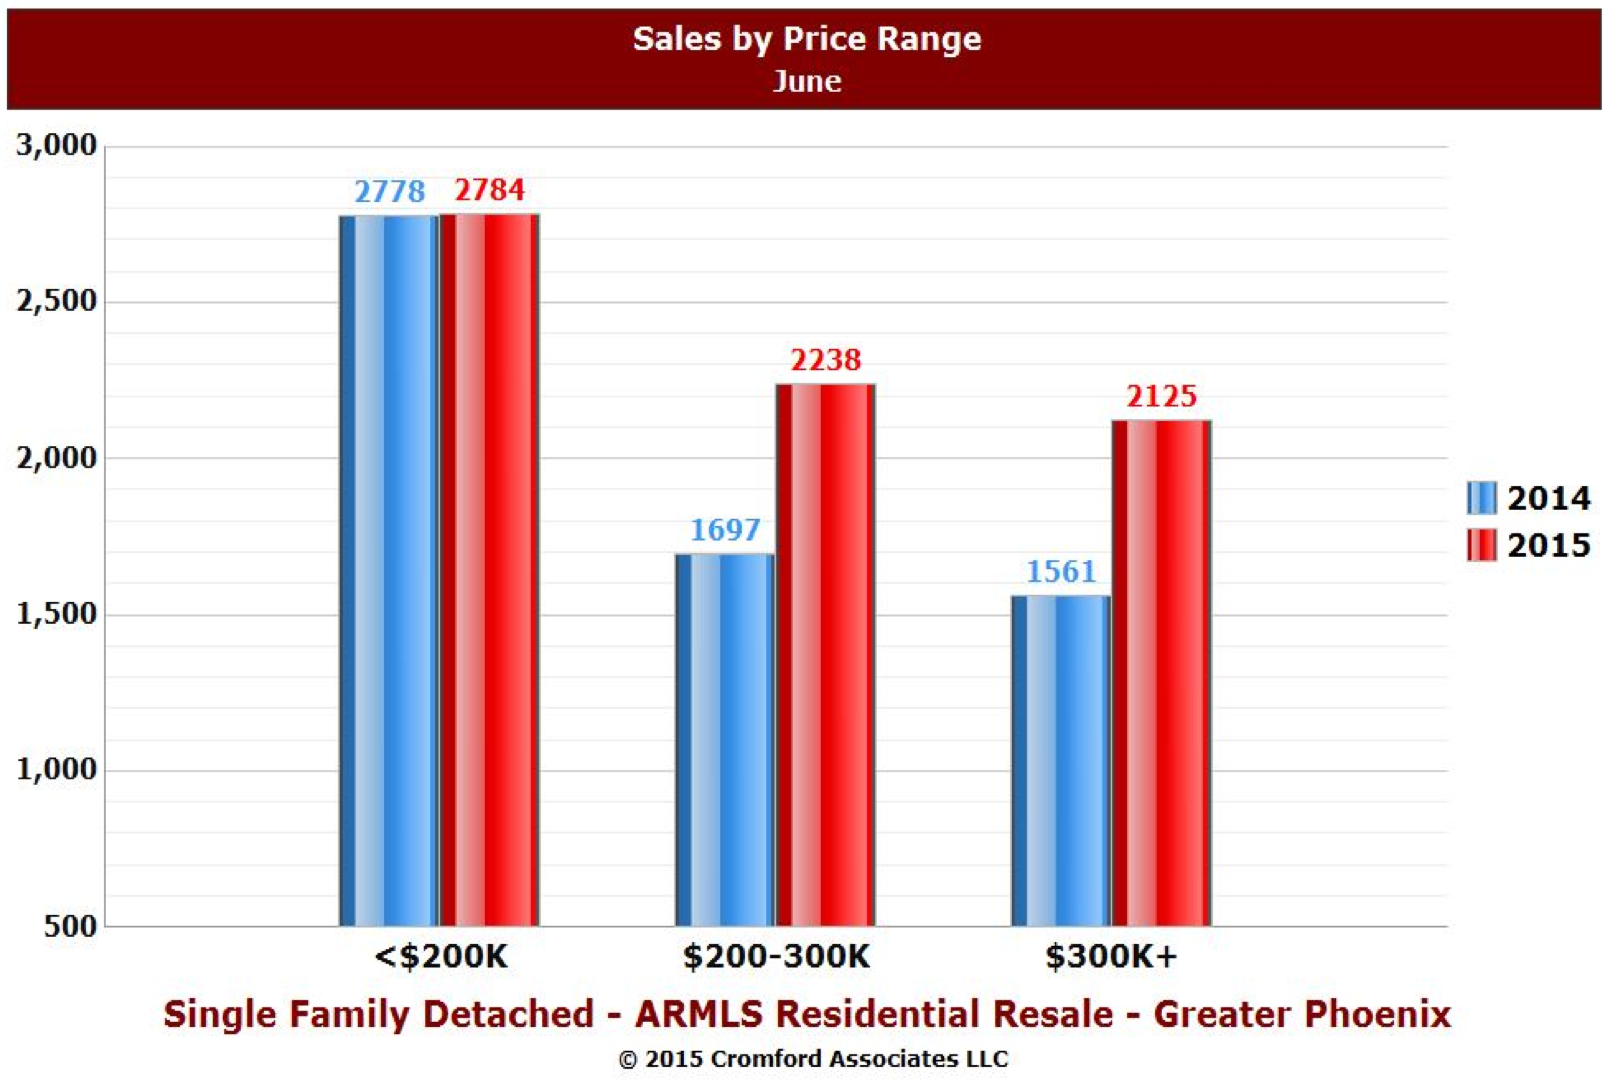
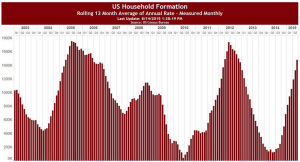
I think its an interesting story for Phoenix, in particular. After the recession, we saw young couples choosing to rent longer, or even live with family for a while. Add that to the fact that this new generation of home buyer is coming on the market with higher levels of debt than ever before, and we see the makings of some serious downward pressure on the sub-$200k market.

However, and there is always a however, CenPho and historic neighborhoods are a little different. Well, in regards to sub-$200k, all of the valley is in the same boat. See in my previous post why we have a shortage, sub $200k. But, its particularly difficult in the urban dense areas because more people are moving in to those areas.

I also covered a few months ago how I believe we are over-building apartment complexes at the peril of owner-occupied properties. There is a six to one ratio of apartment to owner-occupied being built in downtown. That seems way off.

I think we will have options for young couples to own their own home if they want it, but we need to build more in-fill and the city needs to find a way to help.  With 43% of the land mass of Phoenix comprised of empty lots, and many of those owners holding to speculate, we need to get some of those properties in the hands of in-fill developers without the prices being prohibitively high.

Watch this trend if you are looking to buy in the next year to year-and-a-half.

If you are looking for more information, please call me at 602-456-9388.

August 17, 2015by phxAdmin
First Time Home Buyer, Live, Market Analysis

Mid-August Market Status

Thanks again to our friends at the Cromford Report for their excellent analysis on all things real estate.

Here are a few highlights:

“For the monthly period ending August 15, we are currently recording a sales $/SF of $132.74 averaged for all areas and types across the ARMLS database. This is 2.0% below the $135.42 we now measure for July 15. Our forecast range was $131.71 to $137.09 with a mid-point of $134.40. Last month’s mid-point forecast was $1.66 above the actual price per square foot measured, but the actual result was well within the 90% confidence interval.

On August 15 the pending listings for all areas & types showed an average list $/SF of $135.41, 0.5% below the reading for July 15. Among those pending listings we have 86.9% normal, 4.7% in REOs and 8.5% in short sales and pre-foreclosures. The average pricing for pending listings within Greater Phoenix on August 15 in each category was: $140.36 for normal, $98.69 for short sales & pre-foreclosures and $89.08 for REOs.

Our mid-point forecast for the average monthly sales $/SF on September 15 is $131.55, which is 0.9% lower than the August 15 reading. We have a 90% confidence that it will fall within ± 2% of this mid point, i.e. in the range $128.92 to $134.18. We have already experienced considerable seasonal price weakness this summer and our forecast this month is for this weakness to continue until mid September at least.”

AvePPSF-Hist-SFR&Condo-$75-$1mil

Single Family Homes and Condos

So, how does that translate in to the Cenpho and historic markets? Well, while we see higher prices than most areas, generally, and tighter supply, we have seen a similar dip in prices. Interestingly, though, we only see that dip when we include condos in the mix, along with single family residences. See below.

AvePPSF-Hist-SFR&Condo-$75-$1mil

Single Family Homes and Condos

Condos typically take longer to sell, as people are weary to take on HOA dues. This could be part of it. It is certainly interesting news if you are in the condo market.

Watch for these prices to go up again after late September.

If you are looking for more information, please call me at 602-456-9388. 

August 17, 2015by phxAdmin
First Time Home Buyer, Live, Market Analysis

July 2015 Market Trends, Part 2

In my last post, we looked at the number of houses coming on the market and the number selling, as compared to previous years.

HCancel-YTD-2015-07-20
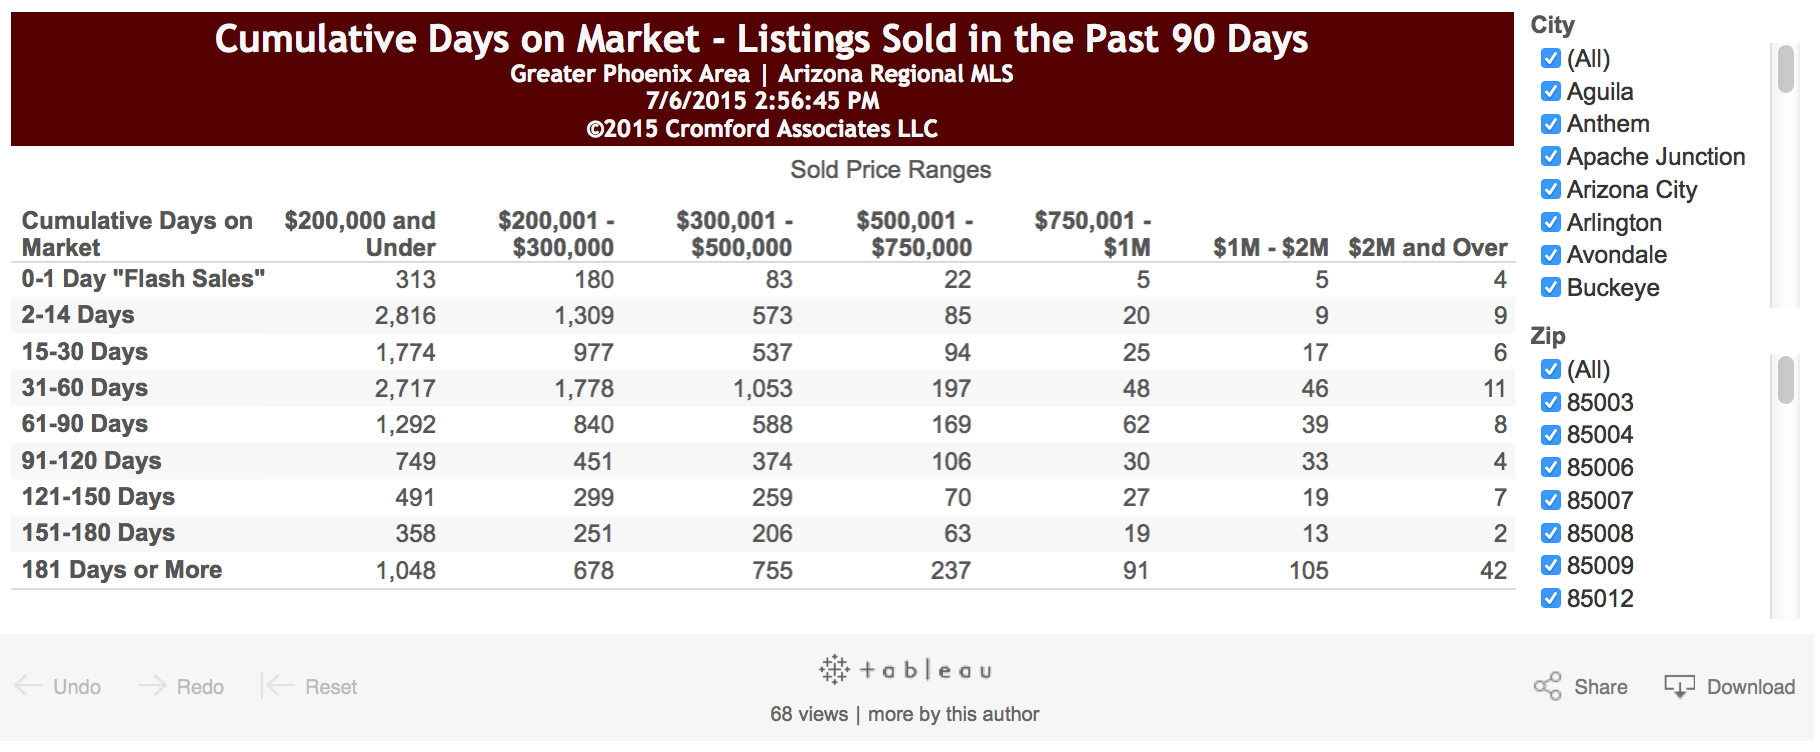
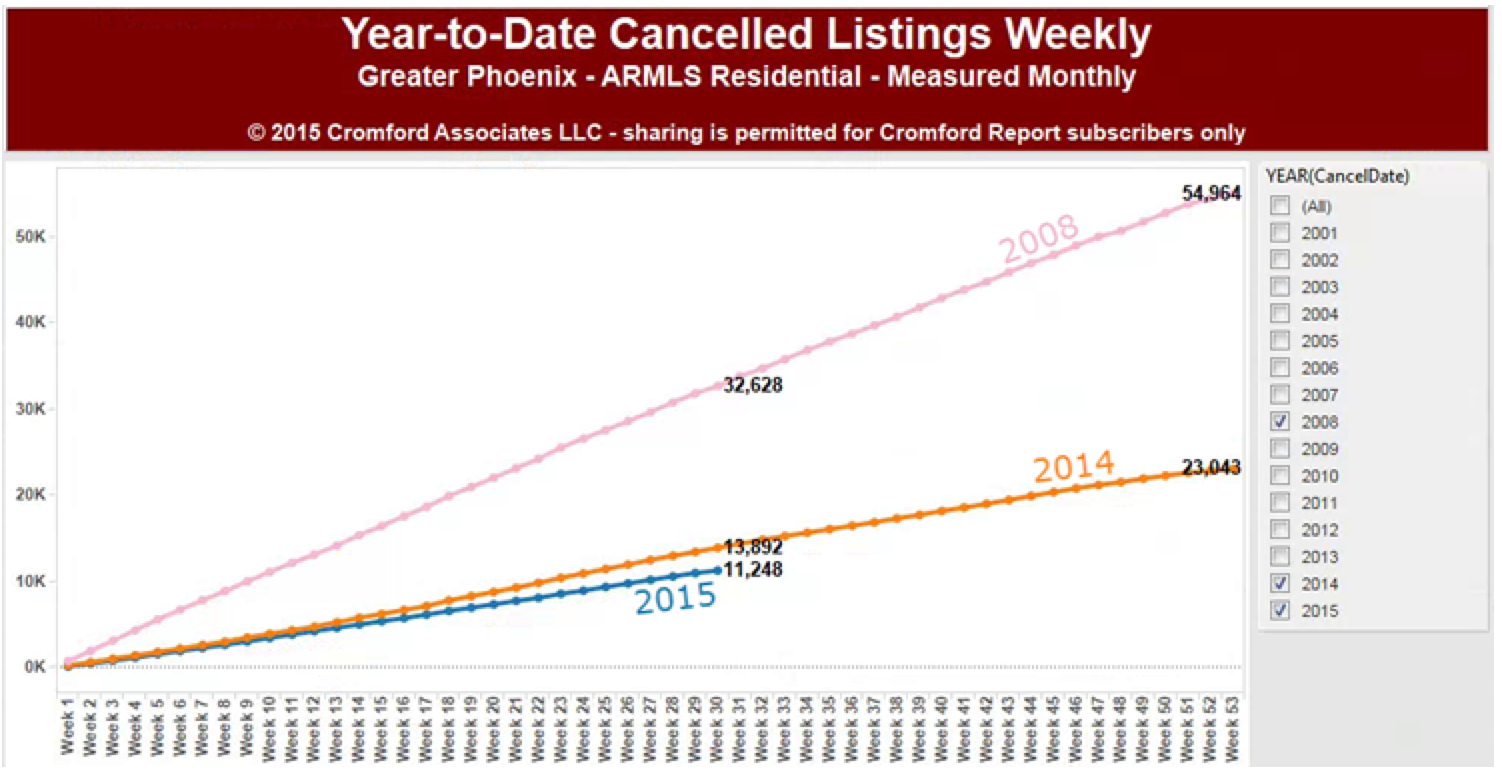
ere’s another interesting indicator: how many listings are cancelled after being on the market for a while.

“Listing cancellations remain very low in 2015 thus far at 11,248 year-to-date; 19% down from this time last year.  Only 3 years in the last 15 years have had a lower number of cumulative cancellations in week 30. 

Those years are 2005, 2013 and 2012.  2008 was the worst year by week 30 at 32,628, which is nearly triple today’s level.”

So, why so few cancellations in 2008? I suspect that it had to do with the fact that people felt like they had no other option than to sell. Many were in houses they could not afford. They had to sell, short sell or foreclose. Whereas in other years, people might have chosen to wait for another year for prices to rise. Their payments were in line with what they could afford, so they had options.

CDOM-YTD-2015-07-20
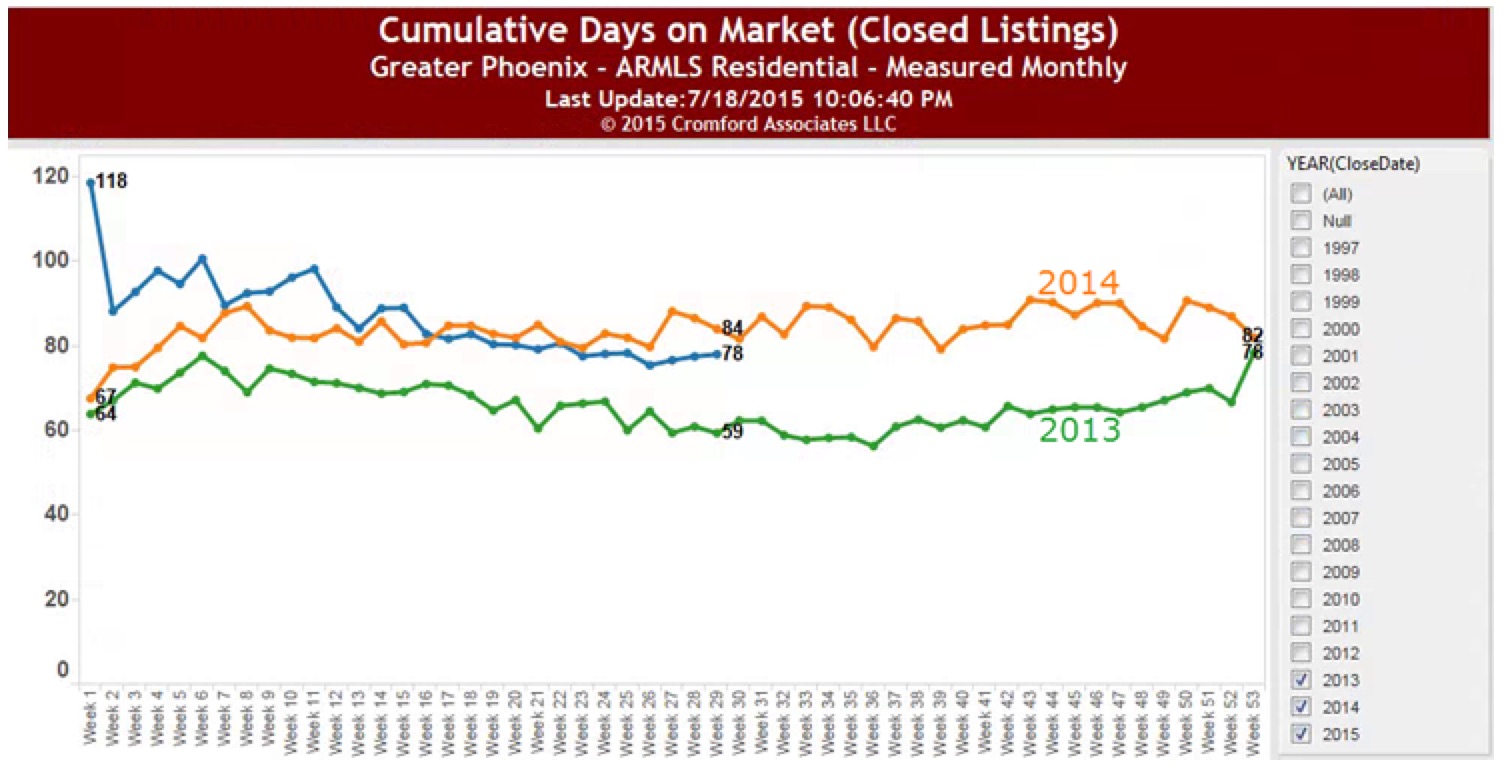
Also notice that the number of days on market (average) is a little lower than last year. So, this year they are selling. Prices are increasing slightly over last year and people are selling homes. I don’t see any indication that these price increases are irrational. However if interest rates rise later this year and buyers can’t get loans as easily, those prices may be forced to come down and this dynamic will change. If that happens, I don’t see major changes in 2015 –probably next year.

So, what does this mean for you? It means that it is a good time to list, especially as people return from summer vacation in about a month. It means that you might want to buy before those people return and enter the market.

Let’s look at your specific situation and build a strategy. Call me a 602-456-9388.

Info Source: The Comford Report

July 27, 2015by phxAdmin
First Time Home Buyer, Live, Market Analysis

July 2015 Market Trends, Part 1

Sales-YTD-2015-07-20Its mid-year and time to take stock of where the market stands.

“Sales volume year-to-date so far in 2015 is 47,661 closings, up 8.8% from this week in 2014 but still 8.7% below 2013.

2006 and 2014 saw similar annual sales volume. 2015 has had 57% more closings than 2008, which was the infamous year prices crashed due to increasing foreclosure supply and decreased demand due to tightened lending standards.”

In other words, people in 2008 were listing them, but not closing. Whereas this year, they are listing them and closing them.

But, don’t take that strong activity to mean that we are heading toward another bubble. We’ve seen this year how there are not as many houses coming on the market as there were in 2008. This year’s price increases seem to be due to shortages, rather than people throwing houses on the market in reaction to a bubble.

NewLists-YTD-2015-07-20
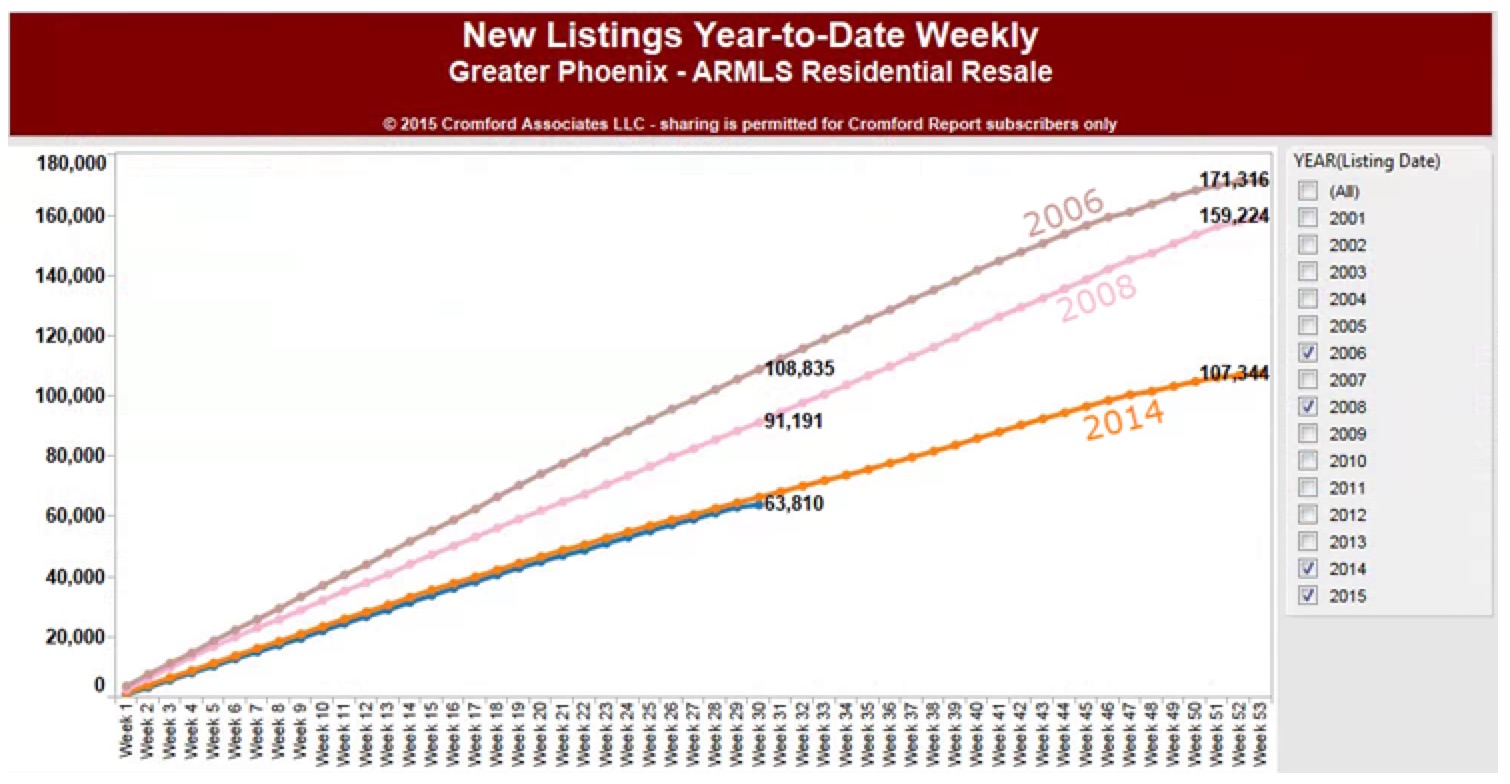
That is why you saw 91,191 listings in July of 2008 but only 63,810 as of this month in 2015.  I suspect if prices continue to rise, more folks will be inspired to list their homes. But, we don’t seem to see that kind of irrational upward pressure right now.

So, what does this mean for you? It means that it is a good time to list, especially as people return from summer vacation in about a month. It means that you might want to buy before those people return and enter the market.

Let’s look at your specific situation and build a strategy. Call me a 602-456-9388.

Info Source: The Comford Report

July 27, 2015by phxAdmin
First Time Home Buyer, Live, Market Analysis

More on Sub $200k Inventory

We’ve been watching for a while how the inventory of homes under $200k have simply not been increasing. See here and here for more background on that.

It has caused an interesting split in the growth of sales of homes in different prices ranges.

According to the Cromford Report, “Sales during June were substantially higher than in June last year, but the gains were almost entirely in the price ranges over $200,000. Under $200,000 there just is not enough supply to generate any growth in sales.”

In other words, as much as people want to purchase homes under $200k, sellers don’t want to sell them. Whereas, in higher price points, the sellers have been motivated by the increase in buyer interest and they put their homes on the market.

My guess is that this situation could become more acute if interest rates continue to rise. There will be more homes for sale over $200k, but they will be less affordable for an entire sector of the buying public.

The lesson is to plan ahead. Even if you don’t plan to purchase for six months, we should get together now to build a strategy. Please give me a call at 602-456-9388.

Cromford-Sub$200k sales 2014-15

July 7, 2015by phxAdmin
First Time Home Buyer, Live, Market Analysis

Flash Sales

My friend Tina over at the Cromford Report was telling me about “flash sales” and how they change with a changing market.

Have you ever been out looking for homes just to be shocked that the home you identify is under contract within 24 hours? It happens all the time. But it happens more in a market that has shifted from a buyer’s market to a seller’s market. There are fewer homes in a seller’s market (in most cases) and buyer have to jump quickly to get what they want.

What is most amazing to watch is when the home that goes in a heartbeat is one that clearly needs work or one that has some serious deferred maintenance issues. Or, even crazier, when a really beat-up home has been sitting on the market for 5 months and then, all of the sudden, three offers come in.

Why is this? Well, its because the supply at that point has shrunk so much that buyers have little choice but to buy that home which needs all the repairs. We’ve seen this a lot in the sub-$200k range these days.

To put is more diplomatically, as Tina does, “As inventory declines sharply, properties that were once continually rejected due to price or condition are found attractive again in the absence of choice.”

Most interestingly, according to Tina, is to see how often homes in the higher prices go in flash sales. Yep, it still happens. See the chart, below.

So, how to you avoid this problem? I tell my clients to start looking before you think you need to. We usually get together as much as 6 months before you think you need to look. We will consider the market trends, your personal situation and then we set up a strategy. If we see some market shifting coming along (which we properly predicted this year), then we will make adjustments to your plans.

We don’t want you getting suck with too few choices. So, call me at 602-456-9388 and we can build your strategy together.

Cromford-Flash Sales-2015


July 7, 2015by phxAdmin
Page 7 of 25« First...«6789»1020...Last »

Subscribe to Our Newsletter

We keep your data private and share your data only with third parties that make this service possible. Read our Privacy Policy.

Thank you! Please check your inbox or spam folder to confirm your subscription.

Categories

  • Art
  • Blogroll
  • Design
  • Editor's choice
  • Events General
  • Events GYP
  • Fashion
  • Featured
  • First Time Home Buyer
  • Homes
  • Life
  • Light Rail
  • Live
  • Market Analysis
  • NeighborhoodVideos
  • Phoenix News
  • Photography
  • Photoshootings
  • Profiles
  • Public Policy
  • Renovation
  • Renting
  • Restaurant Reviews
  • Sustainable Living
  • Tips
  • Uncategorized


© 2015 copyright GET YOUR PHX ® // All rights reserved // Privacy Policy