Get Your PHX - A Whole New Way to Experience Phoenix
  • Home
  • Our Blog
  • About Us
  • Contact
Get Your PHX - A Whole New Way to Experience Phoenix
Home
Our Blog
About Us
Contact
  • Home
  • Our Blog
  • About Us
  • Contact
Live, Market Analysis

Market Update for Oct-Nov 2016

We check in again with our friends at the Cromford Report for another market update.

Each month about this time they look back at the previous month, analyze how pricing has behaved and report on how well their forecasting techniques performed. They also give a forecast for how pricing will move over the next 30 days.

Important take-aways…

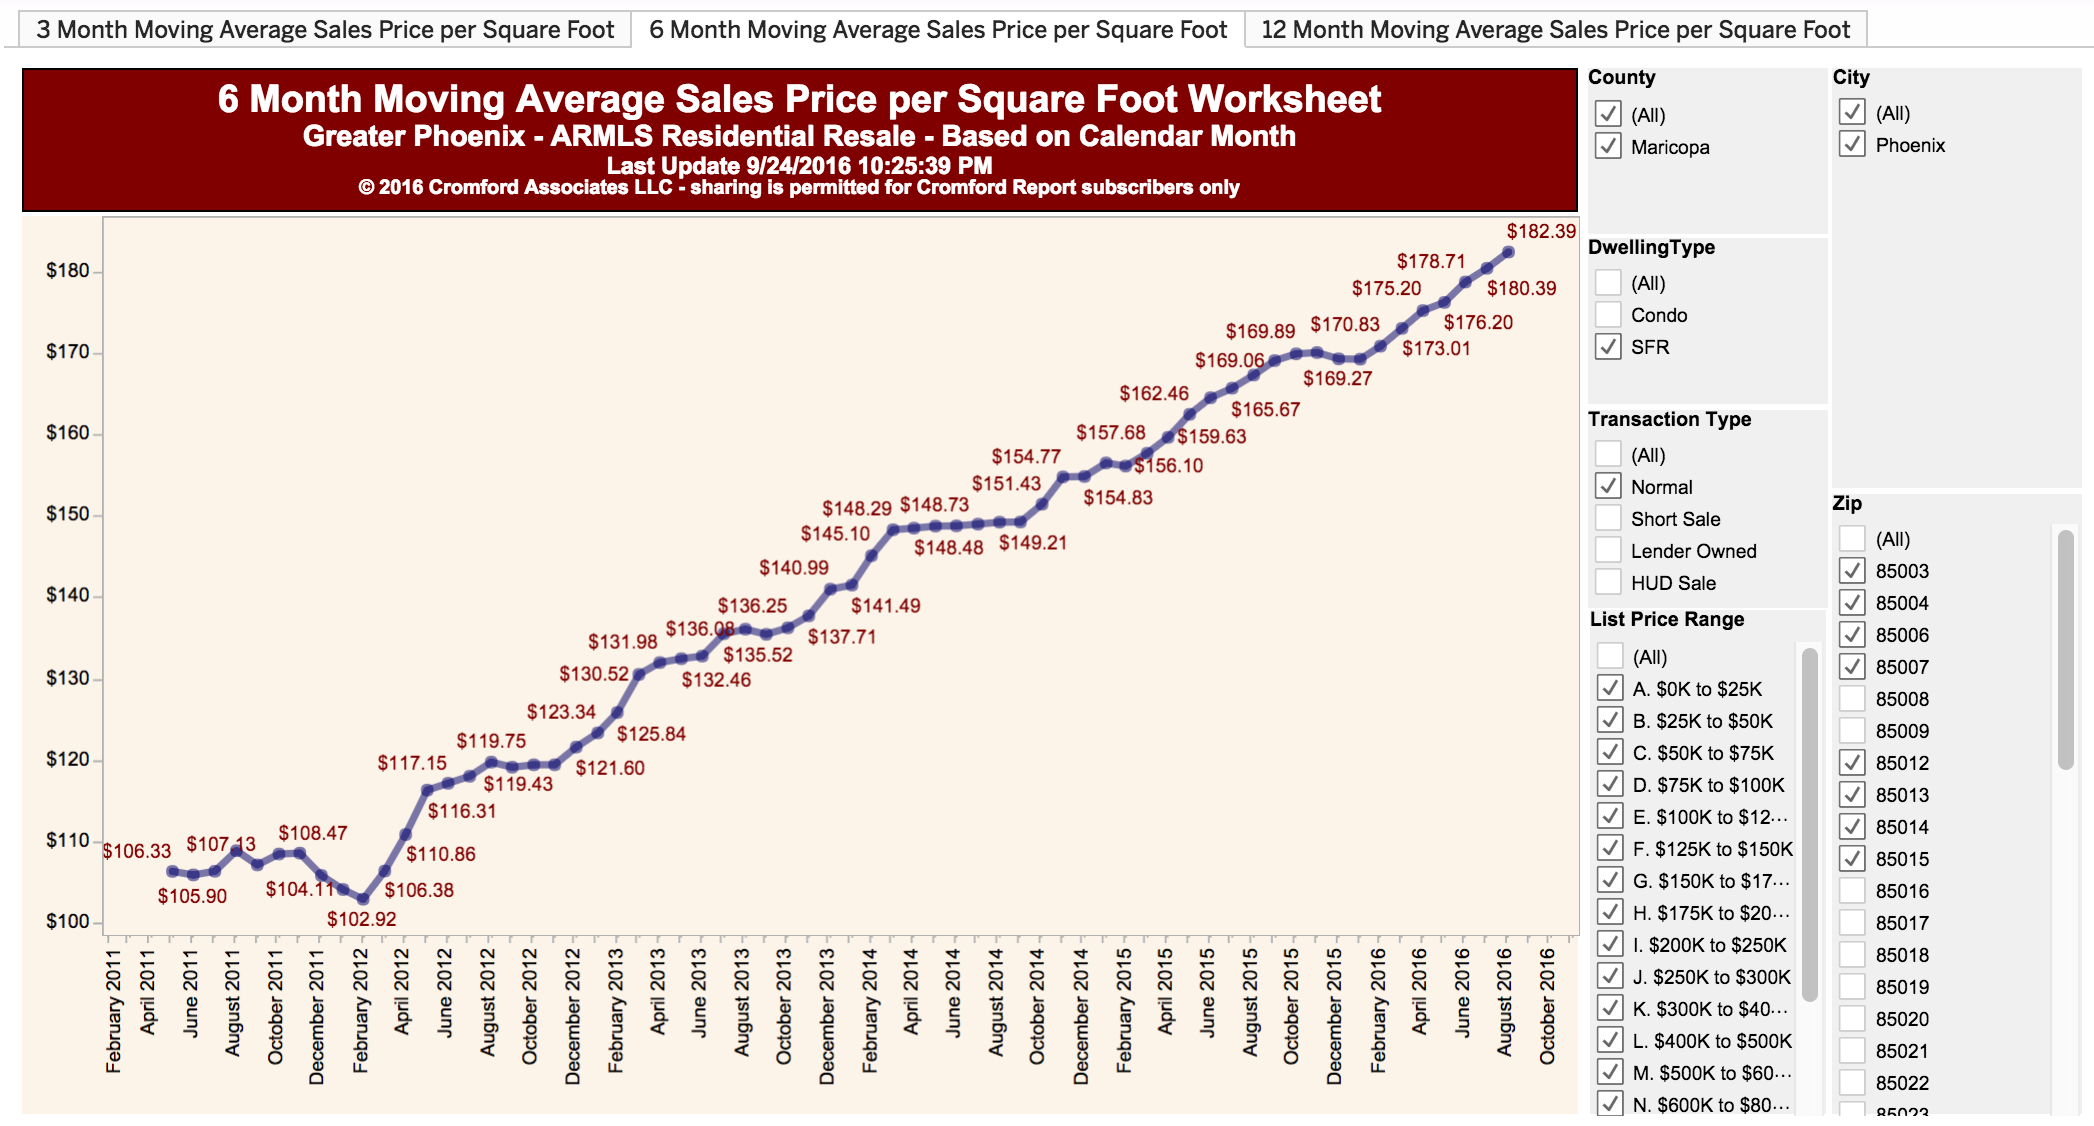
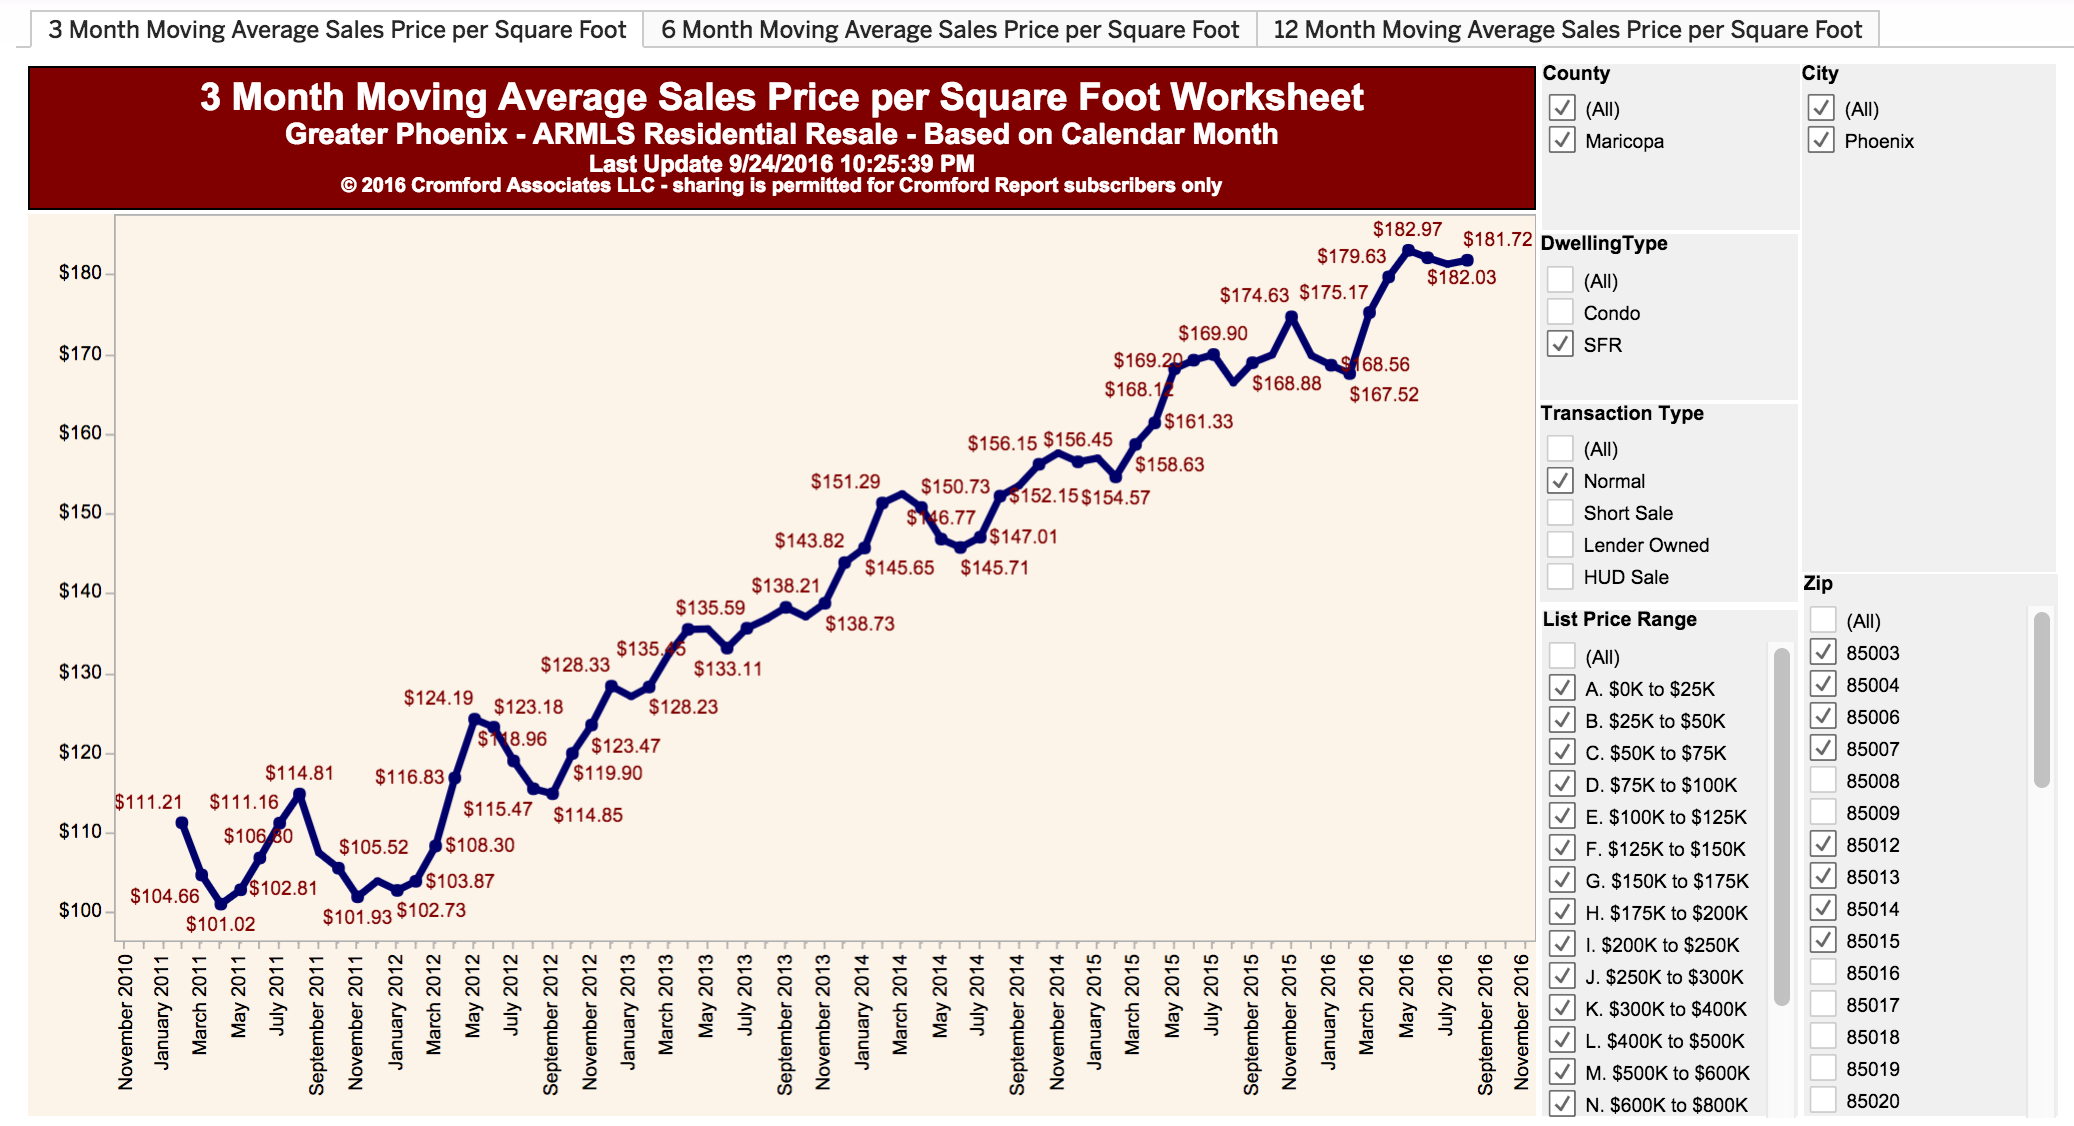
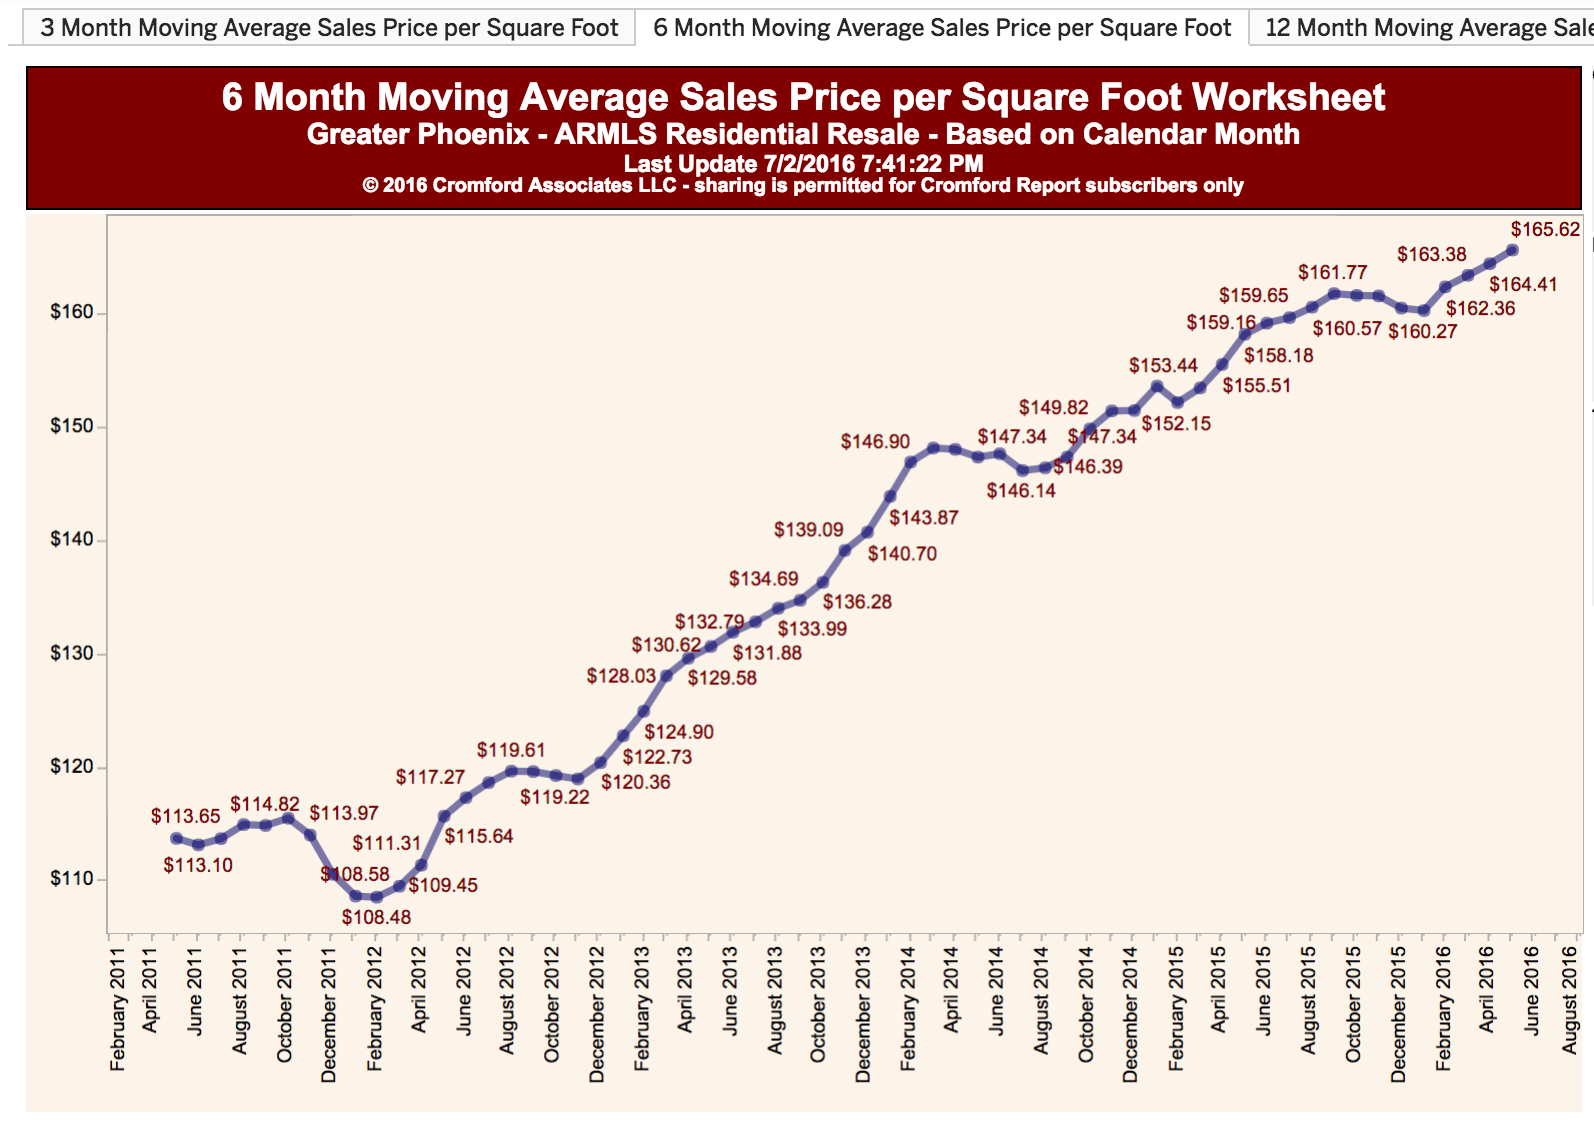
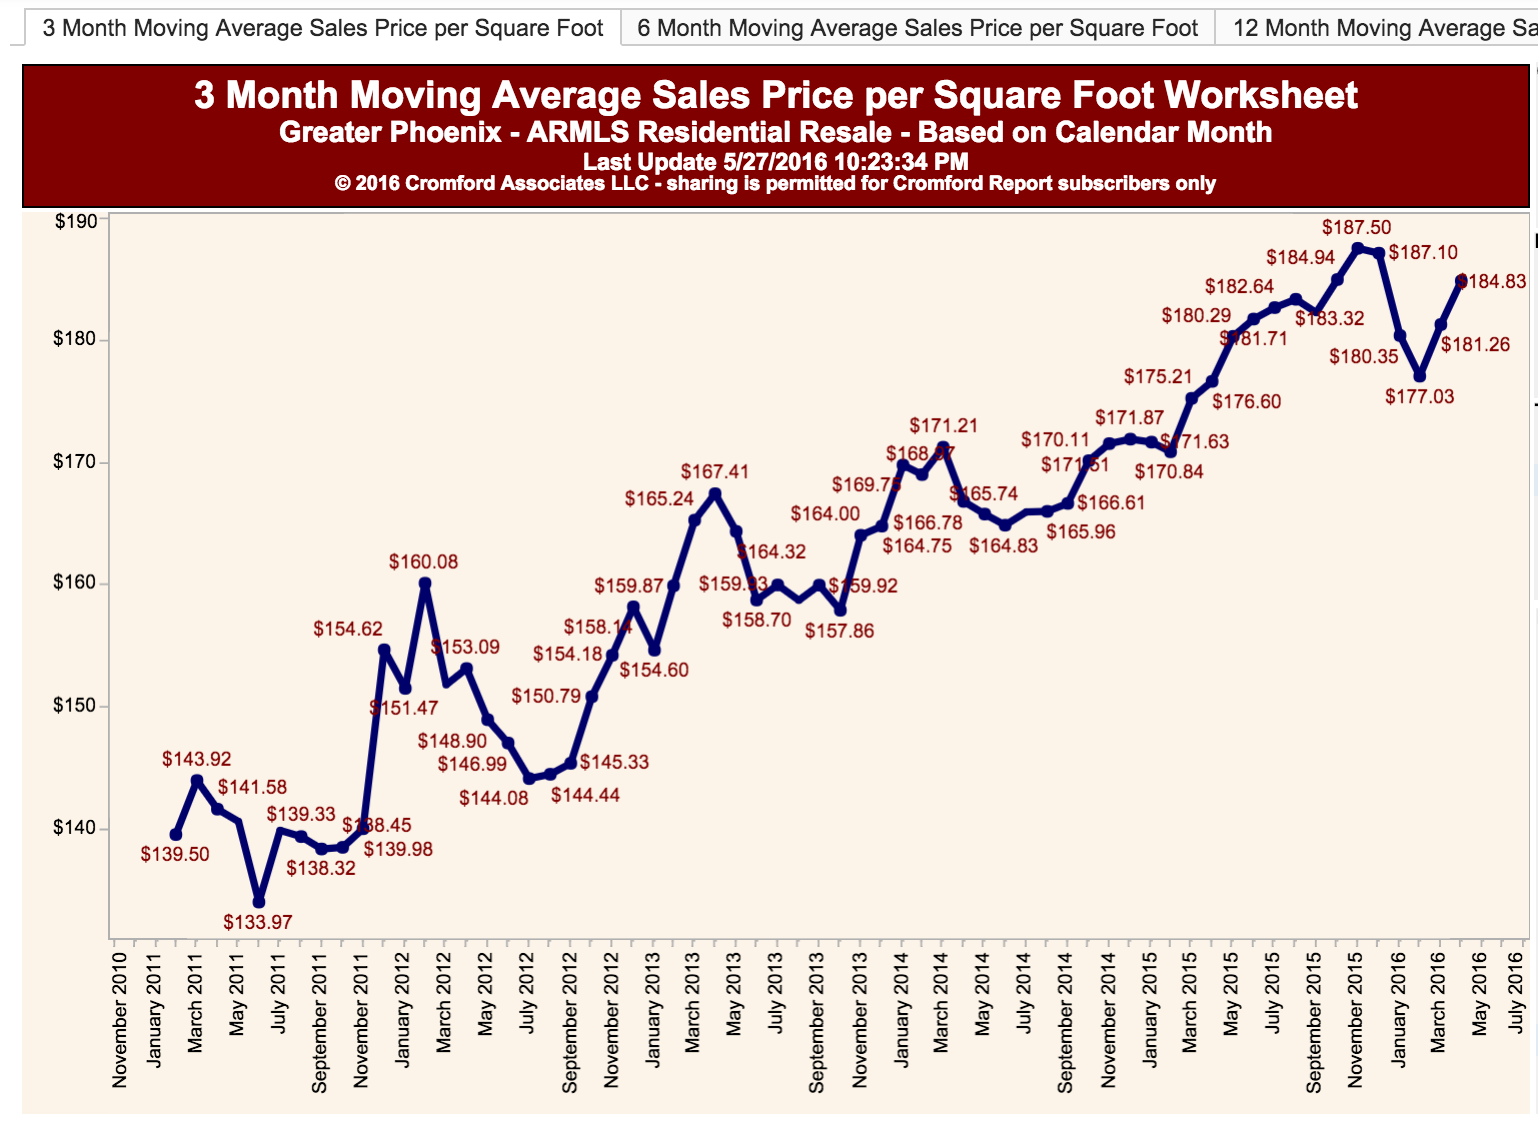
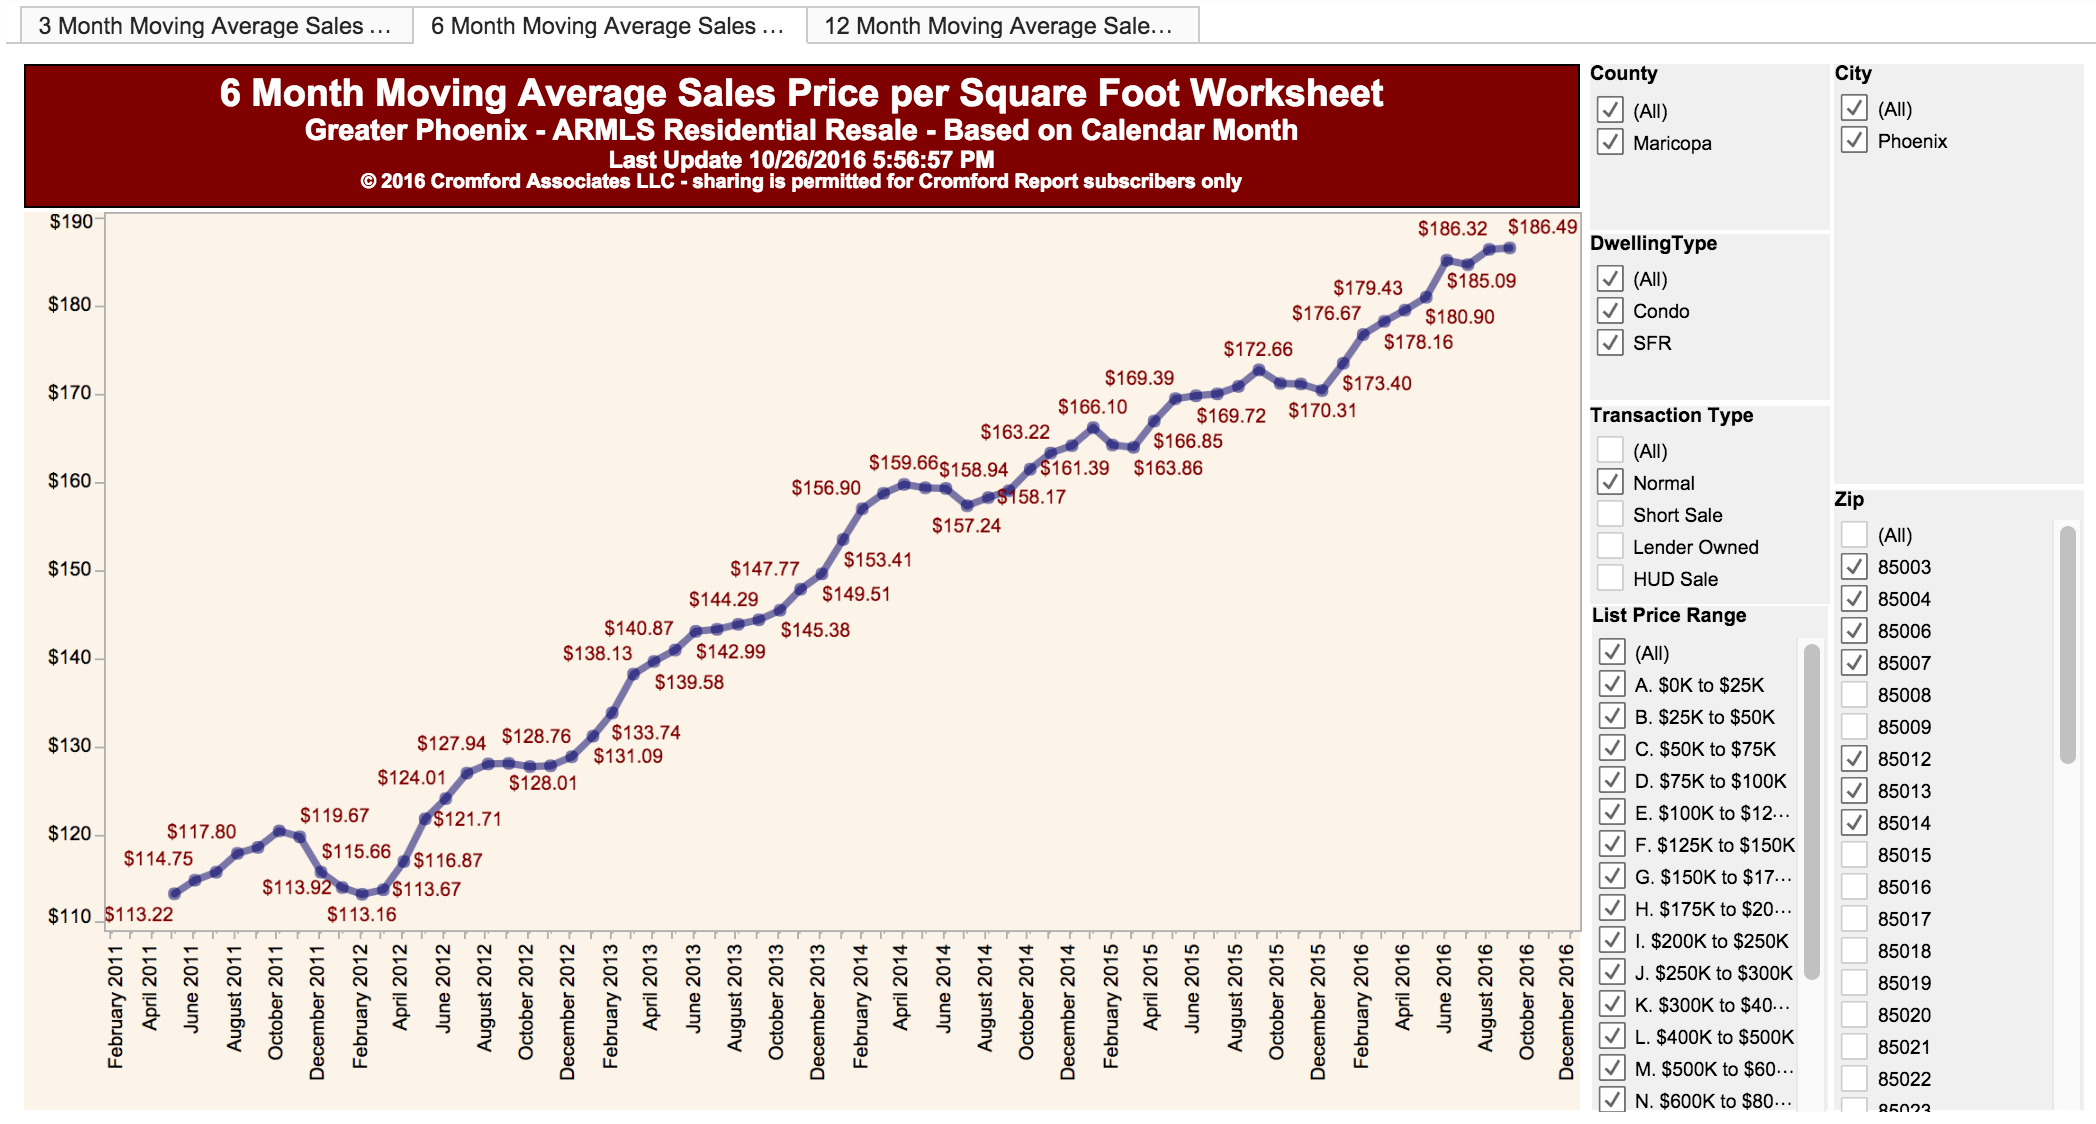
“For the monthly period ending October 15, we are currently recording a sales $/SF of $142.45 averaged for all areas and types across the ARMLS database. This is up 2.2% from the $139.37 we now measure for September 15.”

“After the usual summer lull, pricing has regained upward momentum and it seems probable that will see the highest average price per square foot for 2016 posted during December.”

Anecdotally, Michelle and I are seeing a lot of activity. If you list it, price it well and prepare it to show nicely, it will sell quickly.

cromford-cancelled-listings
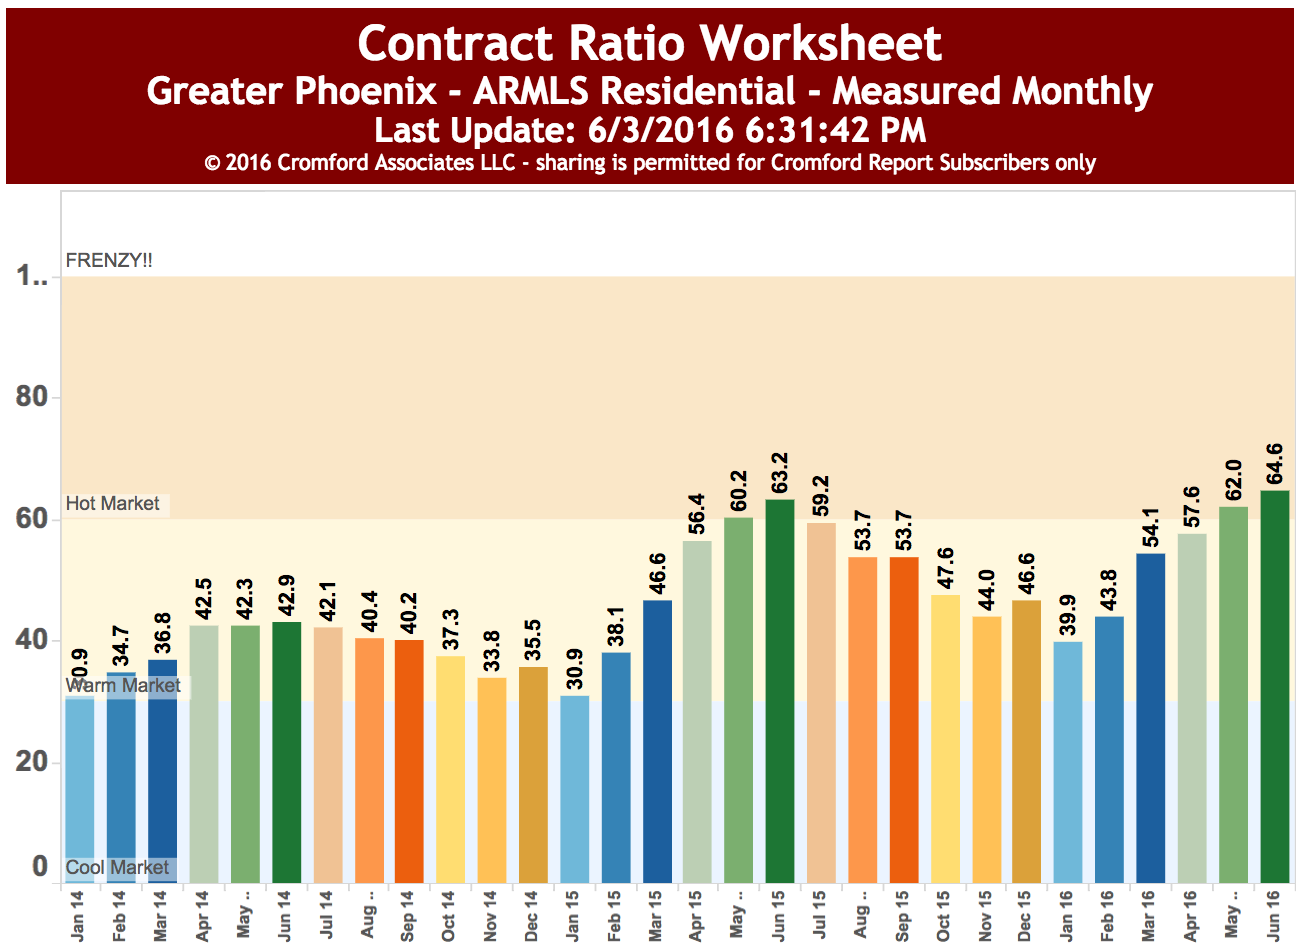
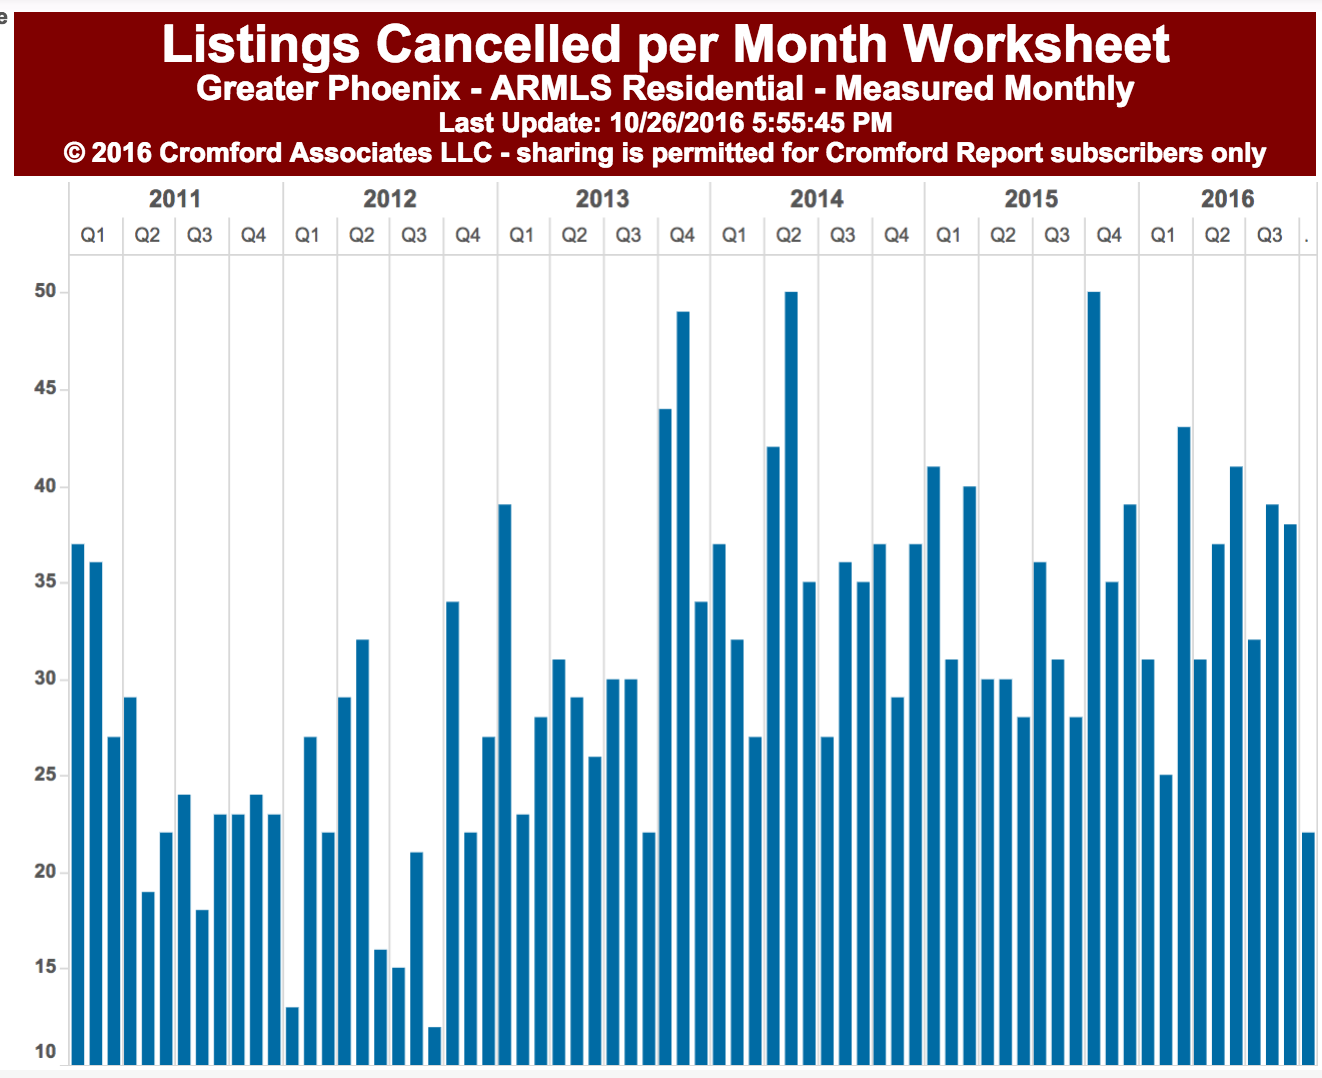
We are seeing listings that go under contract stay under contract. So, cancelled listings are pretty rare, at least in the CenPho and historic areas.

We are still concerned that the market is over-building apartments and ignoring the needs of moderate-income folks who want to live centrally. In other words, we need more owner-occupied. We don’t say this because we want to sell them all. But we know that neighborhoods need a good diversity, even if more folks are choosing not to purchase.

Interest rates continue to stay low, and people are taking advantage of it.

cromford-ppsf-historic
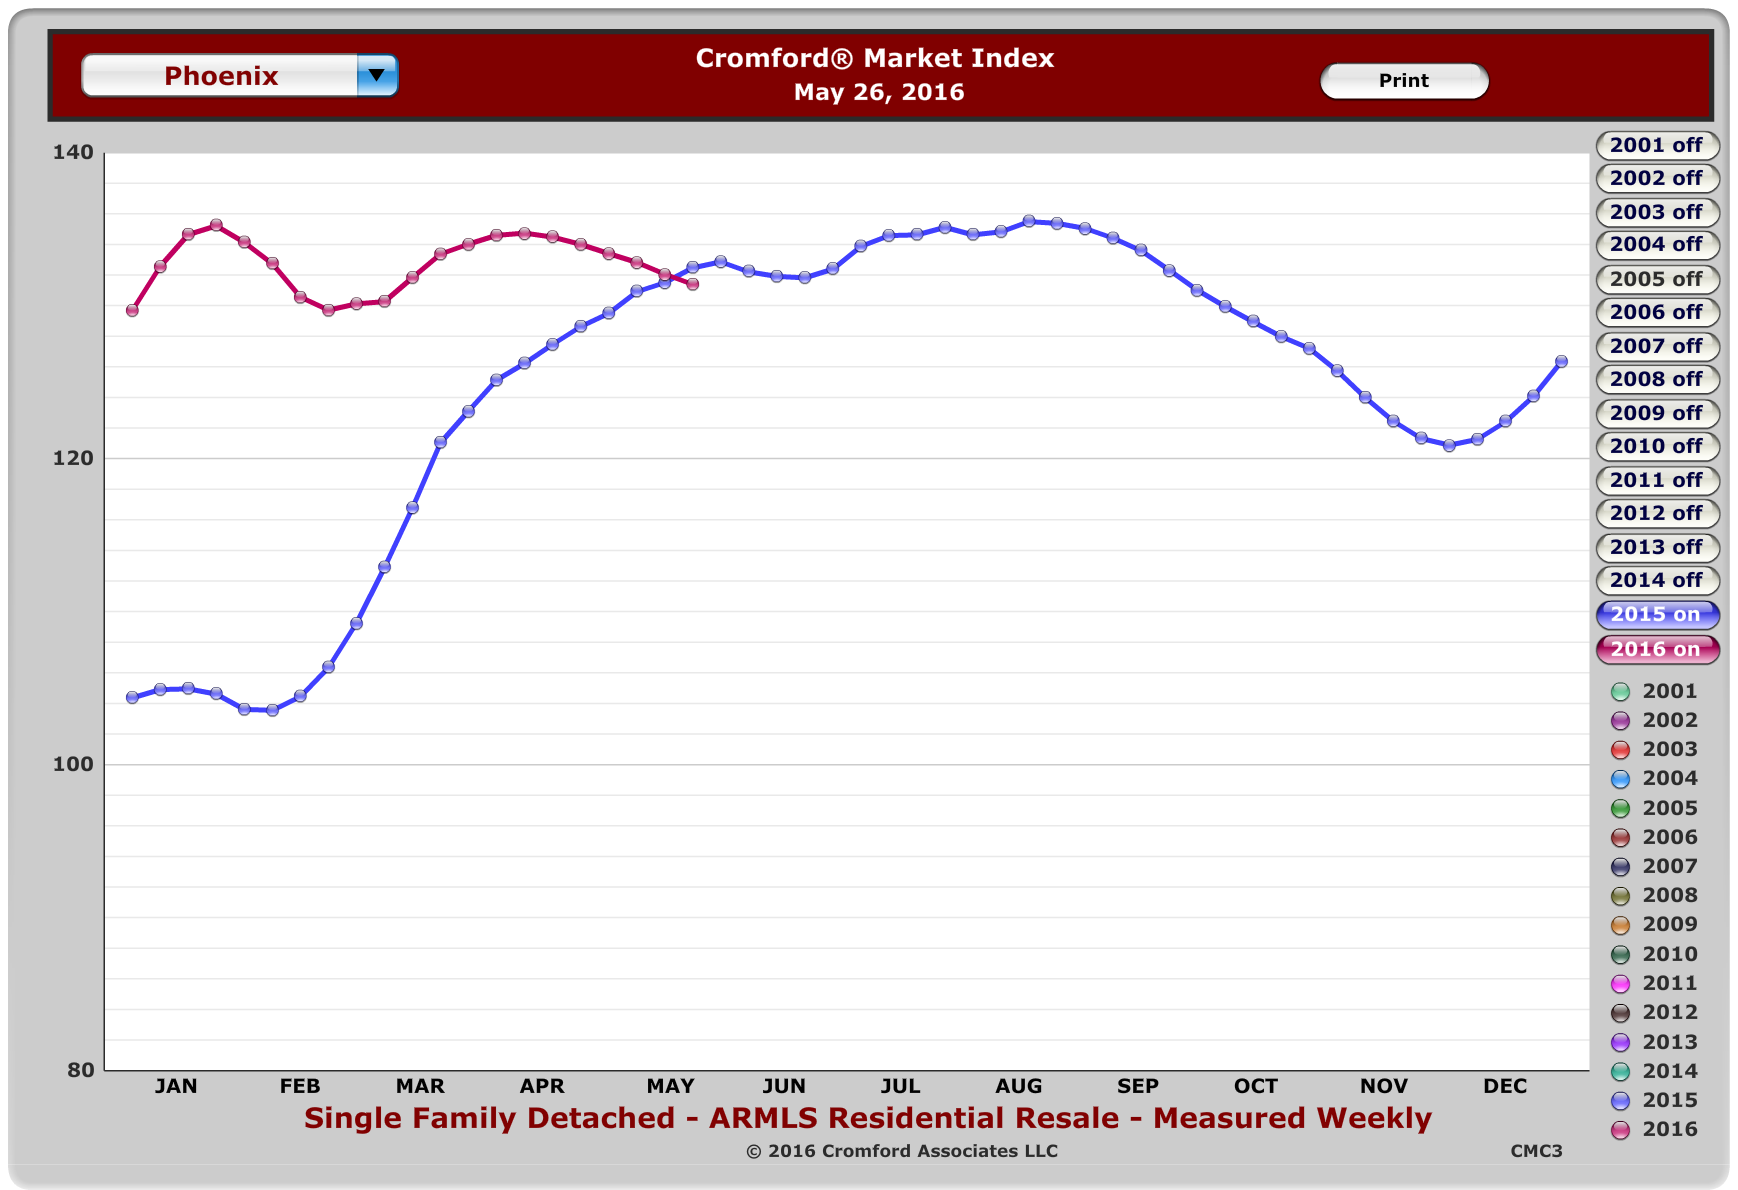
The historic areas have seen a steady upward climb in prices. People are getting solid financing, so we don’t expect the troubles of 2008. There will always be market corrections, but we feel confident that CenPho and Downtown will stay strong because there is a country-wide trend toward living in urban cores.

If you are thinking of selling or buying, please contact us at 602-456-9388. We will help you get the information you need for the right decision the first time.


October 28, 2016by phxAdmin
Blogroll, First Time Home Buyer, Live, Market Analysis

September Market Update

Just in the last 4-5 weeks we found ourselves swamped: listings, buyers, lots of activity.

Something about the impending cooler weather gets people’s juices flowing.

That activity is born out in what the Big Brains™ at the Cromford Report are seeing in their tea leaves.

“For the monthly period ending September 15, we are currently recording a sales $/SF of $139.28 averaged for all areas and types across the ARMLS database. This is up 1.1% from the $137.83 we now measure for August 15.”

6-month moving average

6-month moving averages for price per square foot for the areas of CenPho which contain most of the historic and downtown neighborhoods. No wild swings here.

It is interesting to note that, despite the strong seller’s market, the active list prices are still a little bit above the final sold price. “On September 15 the pending listings for all areas & types shows an average list $/SF of $146.50, up 0.6% from the reading for August 15.”

That means that properties sold for about 6% less (in PPSF) than what they were listed for. That’s expected as people negotiate prices. Further, these numbers are from all areas. So, you may not see that drop off everywhere.

That’s good news for buyers. Even in this strong market, it does not hurt (unless you know there are other offers coming in) for you to try to slice a little off that price.

Its also interesting to see that the distressed sector of the market is back to pre-recession levels. “Among those pending listings we have 92.4% normal, 2.8% in REOs and 4.8% in short sales and pre-foreclosures.”

In other words, no, there really are not many distressed properties out there anymore –he says for the benefit of those who call him every few weeks asking if they can find a foreclosure to purchase for half the going market rate for homes.

3-month moving average

Same historic and CenPho zip codes, 3-month moving average.

The Crazy Cromford Calc Crew™ is predicting slightly higher prices still in October. “Our mid-point forecast for the average monthly sales $/SF on October 15 is $140.36, which is 0.8% above the September 15 reading. We have a 90% confidence that it will fall within ± 2% of this mid point, i.e. in the range $138.27 to $143.91.”

Again, this is county-wide. It could be higher or lower, depending on the area.

The nice thing is, dear reader, that your Get Your PHX Team really knows the neighborhoods. So, we can help you take advantage of these trends, regardless of whether you are buying or selling.

Contact us for more at 602-456-9388.


September 29, 2016by phxAdmin
Blogroll, Live, Market Analysis, Tips

We’ll Buy Your House!

Buy Your House!Have you ever come home to find to find a post card that says “We’ll buy your house.”?

It often looks a lot like this. More recently, the design has improved, making it look like a well-established real estate investment firm has identified your house specifically –rather than by computer algorithm.

They are funny, if it weren’t for the fact that they represent such a loss for home sellers.

They almost always include some text talking about how great your house is, even though the author has probably never seen your home.

They always promise to purchase your home for cash, quickly. Sometimes they tell you that this is a limited time offer because the buyer “has other possible investments.”

So, like any scam, it has the complement, the enticement and the deadline.

Don’t be fooled. More likely than not, the people sending this to you can buy many homes and you don’t need to respond by any deadline.

Similar to this deal are the companies that tell you they can help you sell your home “as a For Sale By Owner” (FSBO), thus saving you money on commissions. Don’t buy it!

But, more importantly, these ads are more likely to lose you money, and maybe more.

Here are some things to keep in mind:

1. Watch the ball! The promise is that you will make more money for your house when you “don’t have to give away 6% to realtors.” But, bear in mind that often times these investors offer you much less than you would “lose” by hiring a realtor.

2.  With a realtor you have somebody knowledgeable in the market who is contractually-obligated to protect your interests. Whereas these “investors” give you an offer and claim that it saves you the cost of paying an agent (6% usually), what they don’t tell you is that you probably could have brought in much more than that 6% or so by having an agent who knows the local market and knows how to do comparables.

3. Fees, fees, fees! Often there are fees that exceed what you would have paid a realtor. This is similar with the FSBO companies. I spoke to one person recently who was thinking of selling a home like this. He said that he was avoiding commissions and that he would not have to worry about doing any repairs. I asked him what fees they were charging and he replied “12%.”My jaw dropped and he explained that this was okay because he would not have to spend any money cleaning up the house or preparing for sale. I could see in his face change as I walked through the numbers for him. “On a $300,000 house, the difference between the 6% commission and the 12% fee is much, much more than you would ever need to hire a team of people to clean your house for you and make minor repairs. You could save thousands of dollars. What could you do with an extra $3,000 or $4,000?”

He is reconsidering that decision.

4. Realtors are licensed professionals for a reason. Its easy to think that realtors just list homes and drive around in expensive cars. But that’s not the reality (says the guy with the 2007 Prius with 170,000 miles on it). We are required to take 24 hours of continuing education every two years and we are liable for mistakes that we make. This is important when you consider things like disclosures. What happens if you don’t disclose something properly when you sell a house as a FSBO? You could find yourself in court, costing much more than you thought you would save.

If you have been tempted by the FSBO pitch or the “We buy houses” pitch, we are more than happy to analyze their offer for you. No cost. If I’m wrong and you could do better selling those ways, I’m happy to admit it. But if I’m right, please consider allow us to make a listing presentation to explain what do to sell your home.

Call us at 602-456-9388 for more.

September 29, 2016by phxAdmin
Blogroll, Live, Market Analysis

September Market Update

Phoenix Metro Infographic - 2016-08Thanks again to our friends at the Cromford Report, here’s the September Market Update, as the days shorten, the nights cool off and kids are ensconced securely back at their school desks.

Summary:
Listings Under Contract up 12%
Monthly Median Sales Price up 7.1%

For Buyers:
If you’ve been frustrated over the past 5 months with high buyer demand for well-priced properties within your price range, you should be seeing some relief now. August is typically a slow time for buyer activity across all price ranges and 2016 is no different. Contracts in escrow began their decline in June, dropping nearly 17% from a high of 13,432 in May to 11,190 by the first week of August.  Active listings have also declined nearly 10%, down to 19,783 since their peak in March at 21,924. At this time of year, many sellers are tired of being on the market, making it a good time to revisit those listings that were not picked up during the peak or came on the market late in the season. August is a very slow month for new listings to come on the market, therefore expect inventory to be relatively stale until more new listings start coming on stronger towards late September and October.

For Sellers:
Yes, the summer is slow in comparison to the busy Spring season. However, there is a bright side for sellers. While contracts in escrow have seasonally declined 17% since their peak last May, at 11,190 this measure is nearly 12% higher than last year’s count.  Another bright side for sellers is, despite the seasonal slowdown of new contracts in escrow, listings under $400,000 are still getting within 98-99% of their asking price after negotiations.  Nearly 28% of July closings through the MLS included some level of seller-assisted closing costs.  That percentage is highest for listings between $200,000 and $250,000 at nearly 35%, and lowest for listings over $500,000 at under 5%.  Be prepared for weekly price reductions to increase next month as more new listings begin to enter the market.

If you need help getting active in the market, give us a call at 602-456-9388.

September 4, 2016by phxAdmin
Blogroll, First Time Home Buyer, Live, Market Analysis

August Market Update

Metro Infographic July 2016The August Market Update shows a continued strong summer. Buyers are having a hard time below $200,000, unless you are looking at condos. Sellers are seeing a continued steady upward climb.

See below for greater details.

This trend is intensified in downtown, as we see more people wanting to live in dense areas.

This graphic is almost a month old, but it is still holding up. Our friends at the Cromford Report are doing a good job turning dry numbers in to digestible graphics.

For Buyers:
Unless you’re looking for a property in the lowest price ranges, there’s a decent amount of supply to choose from in the Phoenix Metropolitan Area.

As prices rise, most buyers will adjust what they buy in terms of size or location in accordance with their budget.  Over time, we’ve seen the average size home purchased continue to rise, even when prices were at their highest.

For example, in 2002 the average sized home purchased was 1,607sf.  It rose to 1,632sf in 2006, then 1,715 in 2011 and 1,762sf so far in 2016.  Of properties sold under $200K in 2006, the average size is currently 1,388sf.  Between $200K-$300K, the average size is 1,829sf.  $300K-$500K is 2,385sf.  $500K-$1M is 3,189sf.  $1M-$2M is 4,421sf and over $2M is 6,338sf.

For Sellers:
The median sales price has risen a whopping $20,000 since January’s measure of $210,000, a 9.5% increase.  This type of disparity can spur articles and discussion about real estate “bubbles” and rapid price appreciation.

This looks very exciting for sellers until it’s compared to the price per square foot measure, which has only increased 1.5% from $138.73 to $140.84 during the same time frame.  The difference in growth rates between the median sales price and the average sales price per square foot can be attributed to a shift in the composition of sales by price range.

Due to the lack of supply of properties below $150,000, the Phoenix Metropolitan Area has seen a significant drop in percentage of sales in this price range.  Simultaneously, there has been an increase in market share within the $200,000 – $300,000 price range where there is also more supply.  The increase in supply over $200,000 keeps individual property appreciation per square foot more sustainable.

However, because the under $150,000 market continues to lose market share as the over $200,000 market gains, the median sales price measure is pushed up higher than the rate of the average price per square foot.  For the median measure to increase, sales over $230,000 would need to achieve 51% market share or more.

July 31, 2016by phxAdmin
Blogroll, First Time Home Buyer, Live, Market Analysis

Interest Rates vs Price Increases

Prices have been going up for houses in Phoenix over the last few years. Not drastically, though. Its not 2007 all over again. But prices have been climbing in a healthy manner for a while.

CenPho PPSF 6 moSo, you say to yourself, “Self, I don’t think I can purchase a home right now. Those prices are too high!”

But the price is not the whole story. Consider the interest rate!

Here’s what I mean.

In December 2013, according to Freddie Mac, average interest rates were about 4.46%. Had you bought a house in CenPho then, you would have paid about $140/square foot.

Let’s say you purchase a 2,000sf home then. The cost would have been $280,000. At 4.46% interest, your Principle + Interest (P&I) would be $1,412.07. (This does not count fees, taxes and insurance. We are not mortgage brokers, so check with them for those details.)

Okay, so fast forward to today. Average prices are over $200/sf in Cenpho. That same 2,000sf home will cost $360,000. At 3.57% interest, that’s $1,630.66, P&I.

To which you say, “Hey, that’s definitely more expensive.”

Yes, but had that loan been at 4.46% interest, the house would have cost $1,815.52, P&I.

Another way to look at it is that you could have purchased a $320,000 home for roughly the same monthly cost with rates at 3.57% as a $280,000 home when rates were at 4.46%.

Does that mean you can afford that house? Maybe. Maybe not. But you are definitely saving $200 per month over where it was when homes were selling for $140/sf.

Interest rates are lower right now and they will not always stay low. On the other hand, there is not much room for new homes in CenPho, other than condos and townhouses, which are not being built in great enough numbers. So, those prices are likely to go up further before they go down. Your chances of getting a home while the interest rates are lower and the prices are lower may be slipping away.

We can help you think through your options. Buy now? Rent for a while longer? Purchase in a different area?

We can help you buy or sell your home. Please give us a call at 602-456-9388.

July 18, 2016by phxAdmin
Live, Market Analysis

July Market Update

Here’s your July Market Update.

As usual, our friends at the Cromford Report give us the broad outlines for the entire state. Highlights:

CenPho PPSF 6 mo“The market conditions improved a little for sellers during June, with the Cromford® Market Index breaking through the 140 level as we enter July. However there is no dramatic new trend, just a continuation of what we have been seeing for several months now. Sales volume was strong during June but it is clear that July will be much quieter for closings since the number of homes under contract has fallen quite a bit. This is quite normal for the season.

…

The ranges from $200,000 to $350,000 saw strong growth in closed sales over June last year – up almost 19%. Between $350,000 and $400,000 we saw a little weakness, down 2%, but sales from $400,000 all the way up to $1.5 million were strong – up an impressive 21%. Sales over $1.5 million were very much weaker than last year – down 44%. Sales below $175,000 were also well down, but this was caused by a lack of supply. The segment over $1.5 million cannot use that excuse. There are plenty of homes available, even though a large number have been removed from the market for the summer. Many of these are likely to be relisted at the end of September.

…

We expect overall prices to be flat to slightly lower over the next 3 months as luxury homes make a smaller contribution when the temperatures exceed 100 degrees. Prices are still rising below $200,000 and falling for most homes over $1 million.”

Contract RatioWhen we look at some of the indicators for Central Phoenix for the July Market Update we continue to see a strong market, as folks really want to live in central.

The chart, above, shows that the price per square foot for detached residential as well as for condos is steadily climbing. No upward bursts that would indicate a bubble.

The chart here shows the contract ratio. That is the ratio of homes on the market that actually close. We are in a hot market when we are over 60%. So, we are right in line with last year, this time.

Anecdotally, we are seeing a lot of renovations. At first we could not figure out how these renovators were making money with the market so high. How can they purchase a property, renovate it and still make a profit.

Then I realized that they are getting low-priced homes from people who respond to those offers they get in the mail to purchase their homes. You know, the ones that say “I love your house and I’ll pay you cash to leave it.” That kind of deal.

But for the numbers to work out, the renovators must be getting these homes pretty cheap, by comparison to what the market will bear.

That tells me that they did not have representation from a realtor. Because they certainly would not have let their homes go for this cheap.

If you get a letter in the mail claiming that somebody wants to buy your house today for cash, please call us at 602-456-9388 and we will help you negotiate a better deal. 

July 5, 2016by phxAdmin
Blogroll, Live, Market Analysis

June Market Update

For the monthly period ending May 15, our friends at the Cromford Report were recording a sales $/SF of $142.50 averaged for all areas and types across the ARMLS database. This is up 1.8% from the $139.96 we now measure for April 15.

Cromford Index May 2016In most years, prices make a lot of progress between March and June so they think 2 months of strong advance from April 15 to June 15 is a very reasonable expectation.

They also expect a retreat to occur between June 15 and September 15, because this is a seasonal pattern that occurs almost every year.

So, what does that “retreat” actually mean to you? Does it mean that prices will fall? I don’t think so. When we look at the Cromford Index (a measure of who has the advantage, and by how much), you can see that sellers have about the same advantage as they had last year. (Anything over 100 is a sellers’ advantage.)

When you look at price per square foot over the last three months in the CenPho area and historic neighborhoods, you see a strong climb for all prices. But, when you break it down, you see more strength in the sub-$200k market than the $200k to $500k market.

Why? Well, probably because there are so many first time home buyers who need homes and they are just not coming on the market. I think there is also a bit of a leveling in the $200-$500k band because many of the renovators and sellers are pricing their homes too high and the buyers just are not buying it.

See below for those charts.

So, what does this mean? I think we are in for a continued strong market through the summer with prices in the lower ranges pushing upward. Michelle and I usually find that the summer still has a very strong market. Well, we are busy, at least!

If you would like to build a strategy to purchase a home or sell your home, contact us at 602-456-9388.

$200-$500k market

$200-$500k market


All prices

All prices

Sub-$200k market.

Sub-$200k market.

May 30, 2016by phxAdmin
Live, Market Analysis

May Market Update

Our friends at the Cromford Report supply us with great data for our May Market Update, which we use to help our clients. Here’s a summary of the data as of the middle of April, in time for this month’s Clark Report.

For the monthly period ending April 15, we are currently recording a sales $/SF of $140.06 averaged for all areas and types across the ARMLS database. This is virtually unchanged (up just 7c) from the $139.99 we now measure for March 15.

Sales pricing over the last 31 days has been considerably weaker than expected but stayed within the lower bound of our 90% confidence range.

In most years, prices make strong progress between March and June so we felt confident that last month’s forecast was reasonable. Only adding 7c to the average price per sq. ft. between March 15 and April 15 is pretty underwhelming. We are forecasting a more impressive advance for May 15, but we could again be confounded by a negative change in the sales mix.

Normally prices decline between June and September each year, so sellers will be hoping for a stronger pricing trend during the next 2 months than we saw during the last 2 months.

This is reflected in the CenPho and historic markets, although the data seems to contradict itself. In short, while the sales prices seem to be going up, the average days on market are increasing and the active listing count seems to be going up.

Cromford-PPSF-6moAve

What does this tell us?

Continue reading

May 2, 2016by phxAdmin
Live, Market Analysis

Get Your PHX April Market Report

April Market Report

Click to enlarge supply price range

The April Market Report, with the help of our friends at the Cromford Report, is here for your viewing pleasure.

First, the supply price range:

When they examine the number of active single family listings by price range, they can clearly see the long term shortage of affordable homes, the adequate supply in the mid-range and the glut of luxury homes for sale.

To put that another way, from $400,000 upwards we have more active listings than we have seen in the last 6 years, so buyers have plenty of choice and therefore negotiating power.

However, below $200,000 we have a chronic shortage of homes available for purchase, and there is precious little to rent too. Here sellers have most of the negotiating power.

April Market Report

Click to enlarge demand price range.

Now, let’s look at the demand price range:

From $225,000 to $600,000 we have far more listings under contract that at this time last year. We also see very strong growth for the sector from $800,000 to $1 million.

From $175,000 to $225,000 and from $1.5 million to $2 million we have moderate increases in listings under contract of between 10% and 15%. For the sector from $1.5 to $2 million this goes a little way to mitigating the increase in supply.

In plain English, th shortage of supply means the market under $175,000 is much smaller than last year, showing there is no lack of buyer interest. Below $125,000 there is not much for sale and buyer interest is lower than last year too.

So, what does the April Market Report mean for you?

  1. If you are looking for a home between $200,000 and $600,000 expect languid growth in the number of listings compared to last year, yet a strong increase in the number of those homes that are pending or under contract.
  2. If you are looking to sell a home between $200,000 and $600,000, expect to sell quickly if you price right.

To build the right strategy for you, call us at 602-456-9388 and we can help.


April 3, 2016by phxAdmin
Page 6 of 25« First...«5678»1020...Last »

Subscribe to Our Newsletter

We keep your data private and share your data only with third parties that make this service possible. Read our Privacy Policy.

Thank you! Please check your inbox or spam folder to confirm your subscription.

Categories

  • Art
  • Blogroll
  • Design
  • Editor's choice
  • Events General
  • Events GYP
  • Fashion
  • Featured
  • First Time Home Buyer
  • Homes
  • Life
  • Light Rail
  • Live
  • Market Analysis
  • NeighborhoodVideos
  • Phoenix News
  • Photography
  • Photoshootings
  • Profiles
  • Public Policy
  • Renovation
  • Renting
  • Restaurant Reviews
  • Sustainable Living
  • Tips
  • Uncategorized


© 2015 copyright GET YOUR PHX ® // All rights reserved // Privacy Policy