Get Your PHX - A Whole New Way to Experience Phoenix
  • Home
  • Our Blog
  • About Us
  • Contact
Get Your PHX - A Whole New Way to Experience Phoenix
Home
Our Blog
About Us
Contact
  • Home
  • Our Blog
  • About Us
  • Contact
Blogroll, Live, Market Analysis

June 2017 Market Update

For your June 2017 Market Update, we check in again with the Cromford Report who tell us, in short, that the market is chugging along at about the same upward climb that we’ve been experiencing thus far this year.

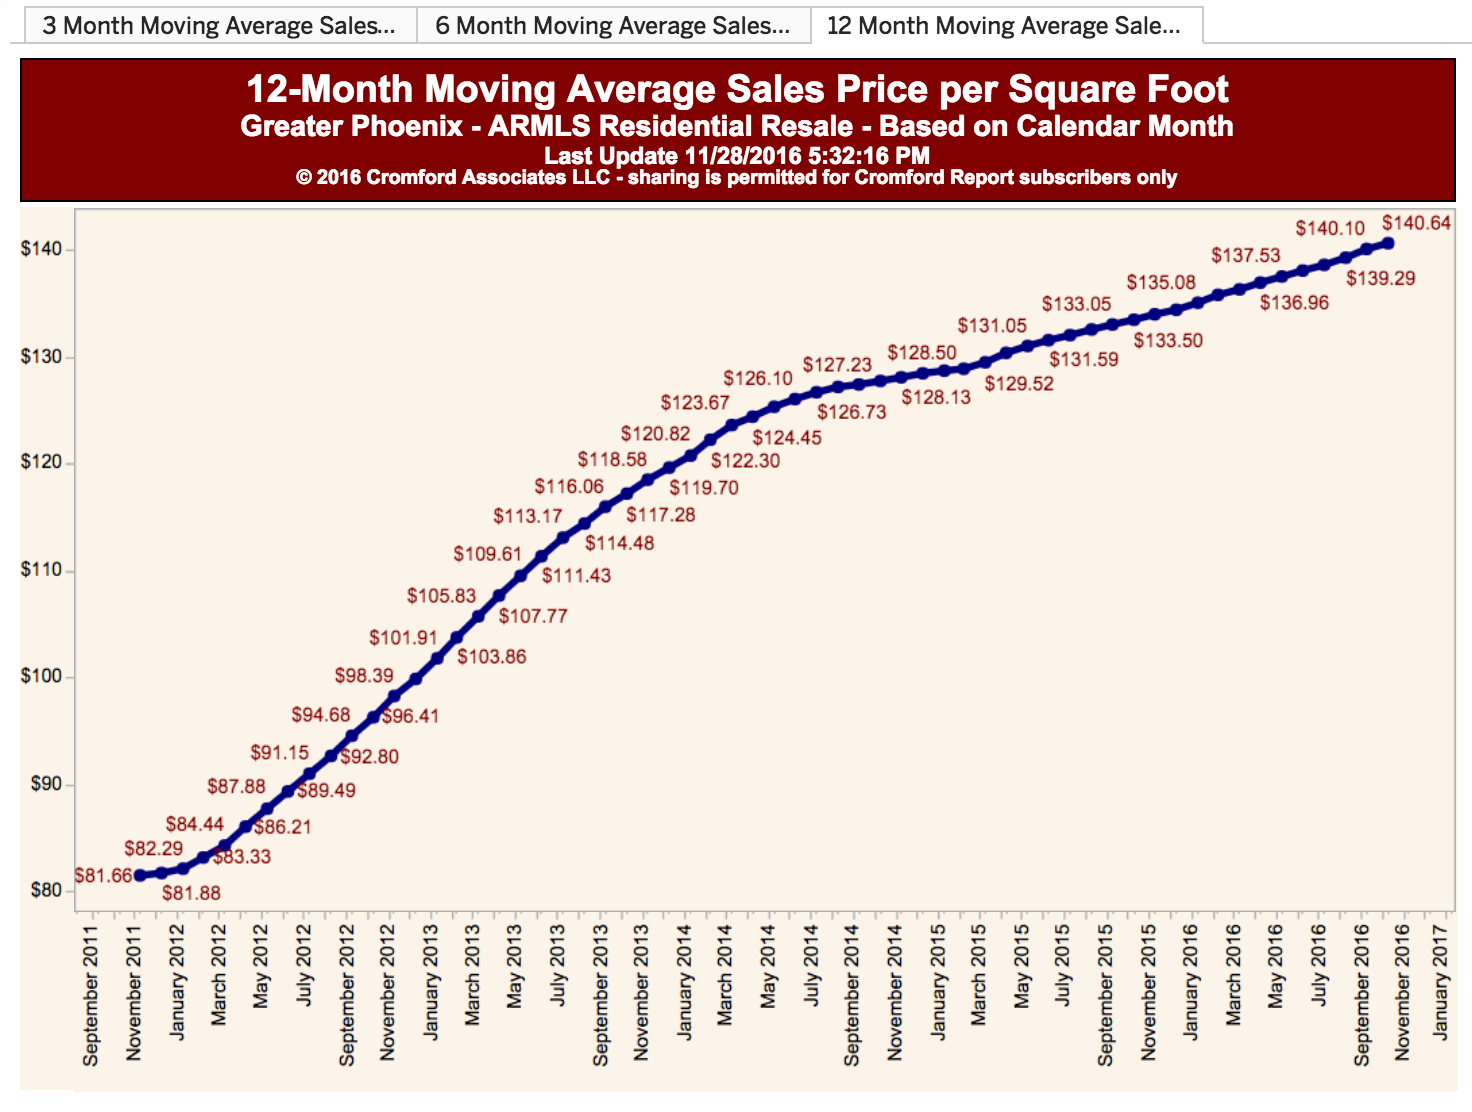
“For the monthly period ending May 15, we are currently recording a sales $/SF of $150.42 averaged for all areas and types across the ARMLS database. This is up 0.1% from the $150.25 we now measure for April 15.  We were correct in forecasting last month that the average $/SF would rise less quickly, but after an extremely strong rise between March and April we saw a very small increase over the past month.

On May 15 the pending listings for all areas & types shows an average list $/SF of $153.97, up 1.3% from the reading for April 15. So although last month’s rise was pretty small, we are still expecting a respectable increase in prices over the next 31 days.

Beyond those 31 days we would expect to see 3 months of price weakness as the third quarter sales mix tends to include fewer high end homes than the rest of the year. However there is no sign of supply and demand converging and the overall long term trend is still upwards.”

Cromford Cenpho PPSF 12mo

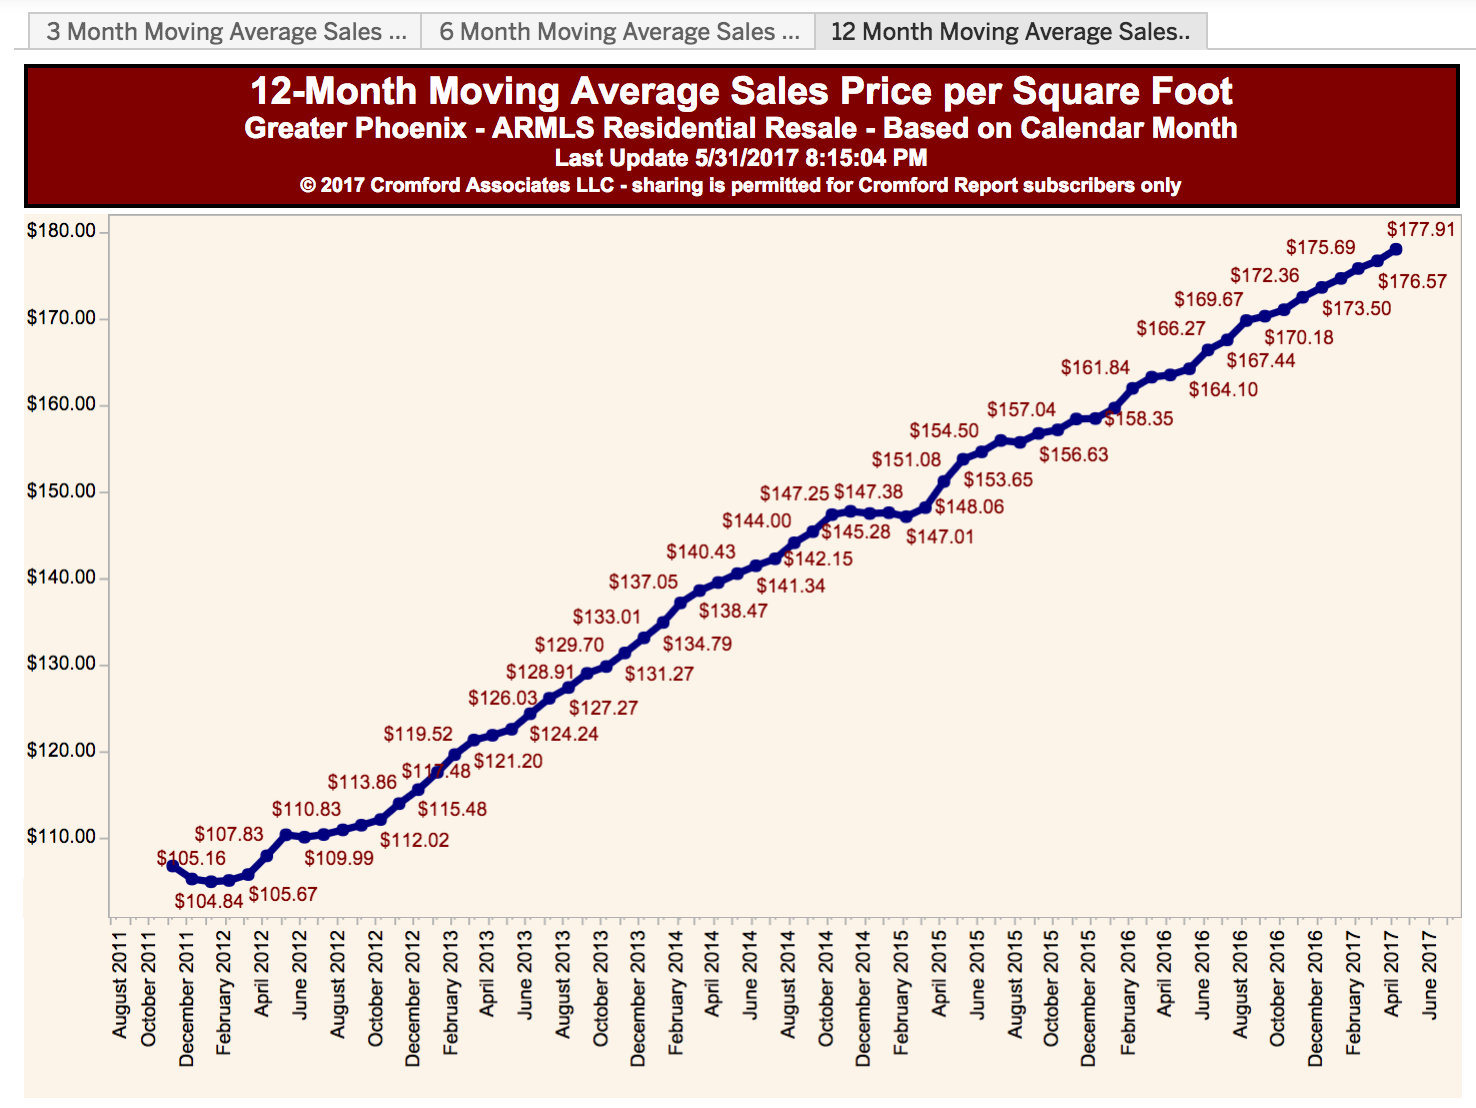
Price per square foot for Cenpho, 12-month moving average

I was on the phone with Tina Tamboer at the Cromford Report this week, speaking about our predictions for 2018 for the June 2017 Market Update. As you recall, I was concerned earlier this year that emigration patterns could have a impact on the market. But, as Tina points out, if people begin to leave Arizona, they won’t do it overnight. It is still too early to tell whether there could be some affect on the market.

We continue to hear rumblings of a market correction in 2018. But, most of what I hear is a “flattening” of about 3%. Well, we’ve seen that growth in the last year, so we are not talking about the type of correction that is likely to result in major losses for home owners who purchased some years ago.

It might mean, however, that if you are waiting for home prices to reach 2007 peak levels in 2018, you might have to wait a few more years.

June 2017 Market Update

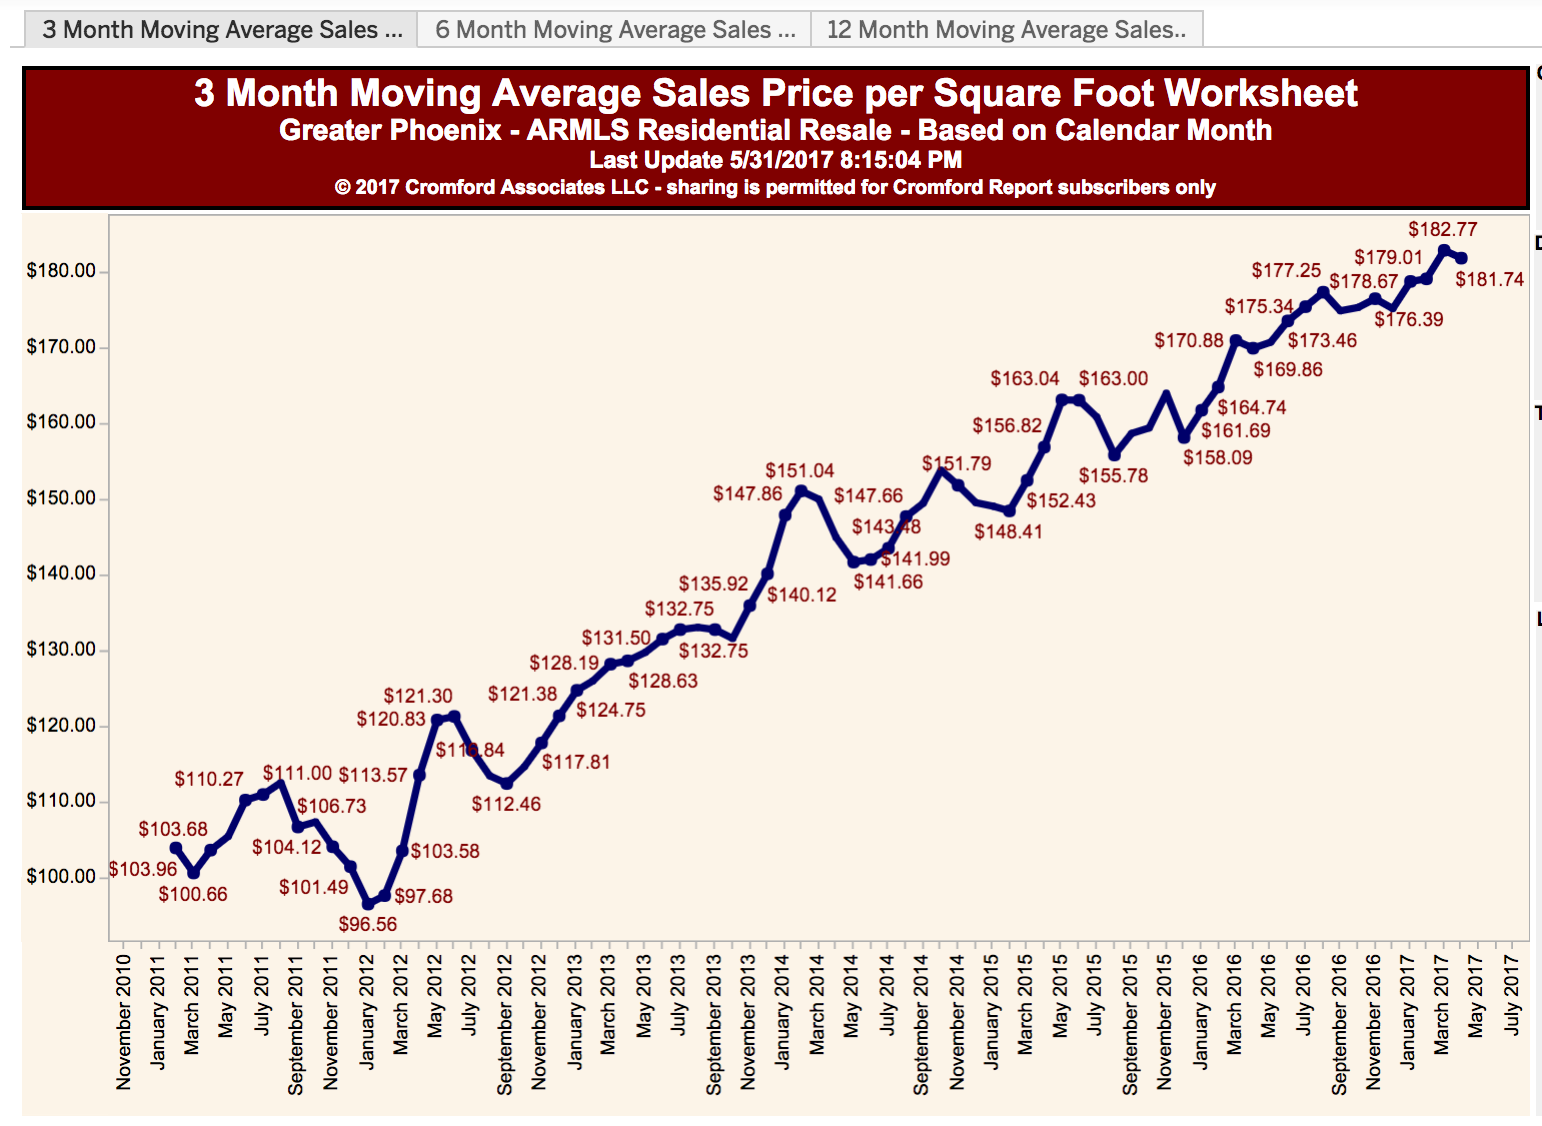
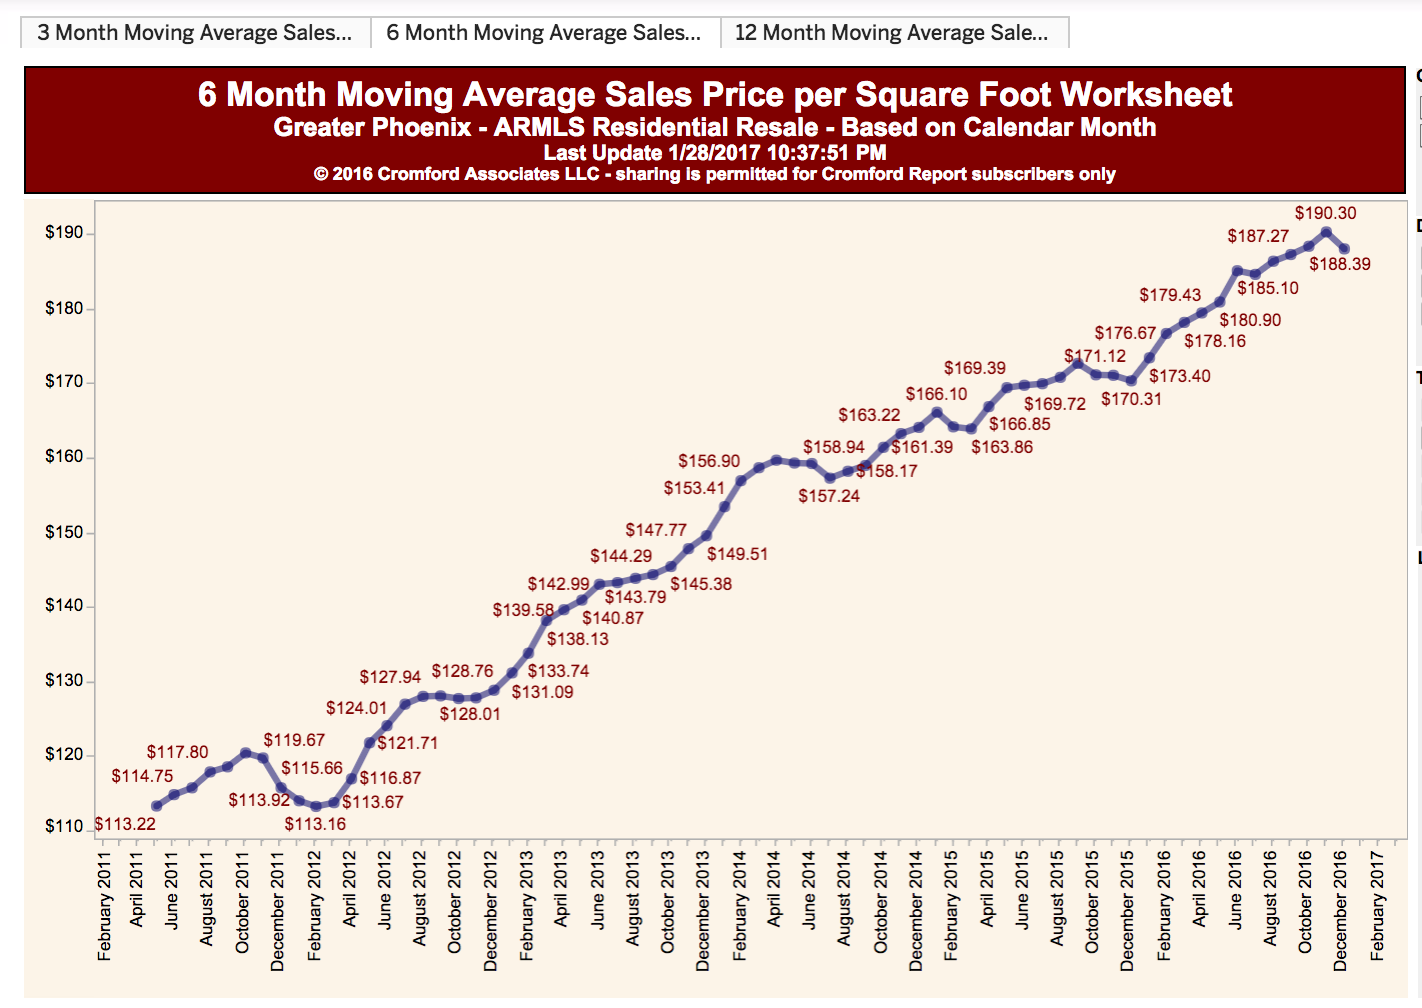
CenPho Price Per Square Foot, 3-month moving average

In the Central Phoenix and historic districts, both the 3-month and 12-month moving averages for price per square foot are strong. People want to live downtown. So, if you are looking to purchase, it is still a good time to do it. If there is a 3% correction in 2018, that won’t even account for the price difference between December of 2016 and today. But, if there is no price correction, then you are looking at even more expensive homes in this land-locked area with no new construction for owner-occupiers. (Thanks, over-built apartment market.)

If you need to put together a strategy to purchase, give us a call at 602-456-9388.

June 1, 2017by phxAdmin
Blogroll, Live, Market Analysis

May 2017 Market Update

May 2017 Market UpdateOur friends at the Cromford Report give us the county-wide scoop for this May 2017 Market Update, as they do every month.

Supply is even further below last year than it was last month, both in total active listings and in active listings with no contract.

The monthly sales rate is down over 6% from last month, but this is a very unfair comparison. March had 23 working days and April, because it had a weekend at both ends, only had 20. With 13% fewer working days we could easily have seen sales drop a lot more than 6%, so demand remained in strong shape throughout April. Sales were up 3% from April 2016, but in 2016 April had 1 extra working day, so that again is a pretty strong result.

Sellers remain in charge of the market in most sectors and price is responding accordingly. The average sales price per sq. ft. is our preferred method of measuring prices and it is up over 7% from last year at this time.

Sales are extremely hampered by lack of supply below $200,000, but above $200,000 supply is more free flowing and sales are up by very large percentages from 2016.

So in summary almost the whole market is humming along with all cylinders firing. However there is little sign that it is going to move up a gear from here.

The Cromford® Market Index appears to be making little effort to surpass its recent peak of 147.5 thanks to a very slight weakening in some demand indicators (including listings under contract). We are at a point where the seller remains in firm control but the seller’s advantage is no longer growing stronger.

Anecdotally for this May 2017 Market Update, we’ve seen a slight slowing in the number of showings in all listings, as the year progresses. I would hate to speculate as to why that could be –anything from national political uncertainty to local unhappiness with the available supply.

But in the end, when we see slight shifts like this, we suggest you watch the market for other indicators of changes. There could be a shift brewing.

We have already opined that, if you are thinking of selling, then 2017 is probably the best time to do it. We are over-due for a market correction in Arizona, and that may put downward pressure on house prices by early 2018.

So, the take-away? If you are thinking of selling, let’s get a strategy together. If you are thinking of buying, you might consider taking a little more time building up cash reserves so you can bring more to bear to your next purchase.

If you need to do both, well, we’d better get a cup of coffee and talk. Please call at 602-456-9388.

May 4, 2017by phxAdmin
Blogroll, Live, Market Analysis

April Market Update

Cromford Index - April 2017Our friends at the Cromford Report paint a picture for this April Market Update of a stable, but upward-trending price line, probably fueled by a reduction in supply.

This may be why we all keep getting those annoying form letters in the mail offering to purchase our homes. (But we all know that those buyers are just fishing for people willing to sell their homes at a discount, don’t we?)

Anecdotally, for this April Market Update, we see lots of buyers coming to us. We’ve also had a fair number of sellers talking to us about selling. Not all are pulling the trigger, so there might be some hesitancy on the selling side of the equation.

There could be many reason for that. Despite record stock market highs, folks might be a little uncertain about what is coming next, and whether they should sell now or wait.

Anyway, so sayeth Cromford:

“Supply is significantly down from last year, especially in terms of active listings that are not in UCB or CCBS status. A drop of 12% is not to be sneezed at and makes life hard for most buyers.

The monthly sales rate is very strong, up almost 11% from last year, though this year over year growth is a little less than we saw last month. Surprisingly, we are not seeing the same growth in pending listings or in listings under contract. These are running close to last year’s numbers.

Pricing continues to advance, though not at any alarming rate. In fact the median sales price is unchanged from last month. This just shows one of the disadvantages of medians – they tend to cluster at round numbers, like $230,000, and resist moving by small amounts. Our more reliable indicator, average $/SF indicates an appreciation rate of 6.1%, better than last month’s 4.8%.”


April 4, 2017by phxAdmin
Blogroll, Live, Market Analysis

March Market Update

Its that time of month when we remember to check our fire alarm batteries, we clean out the gutters after all the rain and, oh yeah, we check in with our friends at the Cromford Report.

Around mid-month, they saw a sales $/SF of $147.97 averaged for all areas and types across the ARMLS database. This is up a very strong 2.0% from the $145.07 we now measure for January 15.

Month's SupplyThey caution, however, “This may sound like a big difference but the monthly average $/SF can change quite a bit over a short period. For example between January 16 and January 21 it rose from $144.88 to $147.00, a change of 1.5% in just 6 days.”

This seems to track (in the very short term, at least) with a small down-tick in “month’s supply of homes.” In other words, if no more homes came on the market today, how many months would it take us to exhaust the inventory? Supply goes down, prices go up.

Days on marketIn the CenPho market, we are seeing a small up-tick in days-on-market. I think this is probably still reflects those folks who listed around the holidays and just accumulated days-on-market, while everybody else ate Thanksgiving dinner and celebrated the New Year, nary a thought of buying a home.

Anecdotally, we are still seeing strong interest from people who want to sell their homes and we are constantly getting calls from new buyers. Over-all right about where we would expect to be this time of year.

See below for the monthly info-graphic from the Cromford Report Folks.

If you are looking for more statistical information for your home sale or purchase, hit us up at 602-456-9388.

Phoenix Metro Infographic - 2017-02


March 1, 2017by phxAdmin
Blogroll, Live, Market Analysis

February Market Update

Your February Market update indicates a continued strong market with sellers having the advantage as we go in to the busiest time of year.

Here’s what our friends at the Cromford Report have to say:

“New listings have been arriving at a slower rate than last year, adding to the problems faced by buyers. Although the overall number of active listings excluding UCB increased by 2.4% during the month, this is an unusually low growth for January and many areas have experienced an unexpected decline in listings over the past 31 days.

This imbalance between supply and demand is true throughout most of the low and mid price ranges, but is less of a factor in the higher price areas, particularly in the outer locations. While this imbalance persists, it is likely to lead to further price rises. We saw a substantial 1.1% rise in the average price per sq. ft. during last month, but the median sales price remained flat for the second month. The average price per sq. ft. is a better reflection of what is going on.”

Anecdotally in CenPho and the historic neighborhoods, we are continuing to see a strong seller’s market, as well as new listings. There is a little dip in prices in the chart below, but it is yet to be seen as to whether this is the hold-over from the end of the year. I would guess that it is more of a blip because the contract ratios are still moving upward, as we would expect this time of year.

In short, if you are looking purchase, you will want to either get on it now or wait for at least a year.

If you are thinking of selling, 2017 is definitely the time to do it.

By the way, we also work in other areas of town. We do this analysis for CenPho and the historic neighborhoods because we get most requests for that analysis.

If you would like us to analyze the market for you in any other area of Maricopa county, please give us a call at 602-456-9388.

Handy-dandy charts for your February Market Update are below:

6mo moving average

The market analysis shows a small shift in prices, but probably not significant.

Cromford Index Jan 2017

The seller’s advantage continues upward as the year begins.

Cromford -Listing CenPho

The number of listings continues to climb. Will that eventually put a downward pressure on prices?


Contract Ratios -the ratio of homes that close in any given month, of all of those on the market of any status

Contract Ratios -the ratio of homes that close in any given month, of all of those on the market of any status

January 29, 2017by phxAdmin
First Time Home Buyer, Live, Market Analysis

The Rhythms of the Market in Phoenix

Real estate is like surfing. If you observe the waves long enough, you get to know the rhythms of the market. You can see how certain seasons advantage buyers vs sellers, or even when conditions might be better for new home buyers.

Have a look at this graph to illustrate. This is called the “contract ratio”. Its the ratio of all properties that actually sell and close, out of all of those listed each month.

cromford-conratio-all-2016-11-29 Rhythms of the MarketFor our purposes, the ratios represented in of this chart are not as important as the pattern you can see – the rhythms of the market. Notice that the percent of homes that sell and close tends to go down at about the same time every year: July – January. The percent goes up at about the same time every year: February – June. If you look closer, you will also see that Sept – Oct often stay very stable.

Why?

Well, more people are looking and purchasing from February to June. That means more buyers and more sellers. But, look. If you consider that most homes take 4-6 weeks to close from the time they are listed, then you can see that the homes listed in January represent the up-tick that you start to see each February.

The converse is true, too. If you are listing a home to sell in June, you have already crested that wave and fewer people are out looking for homes.

What I’ve observed by watching the rhythms of the market over the years is that you should list in January if you can. If you can list in the first half of the year, then aim for September. People tend to be back from vacation, and they get serious until Thanksgiving, when the tryptophan in their turkey puts them to sleep until about mid-January.

What you absolutely want to avoid doing, if you can, is listing in October or November. You will likely just accumulate days on market with fewer people out looking for homes.

Michelle and I have several new listings coming on in January and February. We know already that 2017 is supposed to see Phoenix as one of the busiest markets in the country. Now is the time to look (before interest rates go up) and now is the time to list (when people are the most active).

If you have questions about listing your home, give me a call at 602-456-9388. We can help you surf those market waves.


December 31, 2016by phxAdmin
Blogroll, First Time Home Buyer, Live, Market Analysis

January Market Update

phoenix-metro-infographic-2016-12 January market updateYour January Market Update finds the market generally healthy and likely to start the year strong, according to our friends at the Cromford Report.

“There is both good and bad news for first-time home buyers this month.  The good news is that there’s been a 22% increase in single family active listings asking between $175,000-$200,000 over the last 10 weeks, going from 1,065 to 1,295.  Current inventory is 10% higher than where it was in week 49 of last year, adding some much needed choice to a high demand price range.  The added supply is not universal across the valley; increases have been marked specifically in Buckeye, Surprise, Sun City, Peoria and Mesa.”

As you know, we do most of our work in Central Phoenix, North Phoenix, Downtown and East Phoenix (although we work everywhere in Maricopa County). The bad news for first time home buyers in the January Market Update is that this increase in affordable inventory is not as apparent in the sought-after areas of CenPho and downtown. We can only hope that this bubble of apartment building in CenPho will break and we will see some affordable owner-occupied developments in 2017.

Despite the bad news in this category, don’t give up. We know the area really well and we can point first time home buyers to the up-and-coming areas that are more affordable and undergoing redevelopment.

Back to Tina Tamboer at the Cromford Report:

“The bad news for home buyers is that supply overall is down 3.7% while the level of competing buyers is remaining seasonally consistent.  The Southeast Valley specifically has not seen the typical increase in supply that happens this time of year.  This indicates that the area will kick off 2017 with low supply just before the expected increase in buyer activity come February.  In this case, the cost of waiting to purchase will be a lack of choice and possibly having to compromise on the condition or location of the property they choose to buy.”

For Sellers in this January Market Update:

“Bad news for buyers usually translates into good news for sellers, especially after positive news reports of Realtor.com ranking Phoenix as the #1 projected real estate market in the country for 2017.  However, it’s still not a market to be overpriced regardless of the strong demand for homes.  Some price ranges have more competing listings than others, especially in areas such as North Phoenix, Mesa, Gilbert and Peoria where there is competition from new home subdivisions.  Permits for single family homes have been on the rise to accommodate the demand.  This provides more choice for buyers in those areas, balances out the market and keeps annual appreciation in check.  The areas projected to have the highest appreciation rates are those where there is a high level of fix and flip activity along with a more affordable price range under $175,000.”

In the end, we can help you navigate this new year –whether you are buying or selling. Just give Ken a call at 602-456-9388.

December 31, 2016by phxAdmin
Blogroll, Live, Market Analysis

More on Deportation in the Phoenix Market

Deportation from the Phoenix market

Source: MSNBC

Here is more on deportation from the Phoenix market. In a previous post, I touched on how plans to deport millions of undocumented residents could impact the real estate market in Phoenix.

I told you that we are not likely to see any mass movement any time soon.

But there is one shift that could happen if there is deportation from the Phoenix market, and it has to do with jobs and interest rates, nationally. You’ll want to keep an eye on this.

First, know that the unemployment rate just hit the lowest in 9 years on December 2nd, 2016. That is good, over-all. It does not mean that everybody is fully-employed or that they improving wages. But, it is better than it has been.

But it means that the Federal Reserve Bank is watching out to make certain that the economy is not about to overheat. What happens with full employment? When there is full-employment, employees begin to demand higher wages and that puts up-ward pressure on inflation. So, the Fed raises interest rates to slow that growth, reduce wages and inflation.

So, as reported on the Marketplace Morning Report today, if a Trump presidency is able to deport millions of workers just at a time when the economy needs them, unemployment will reduce further, and the Fed will be pushed to increase interest rates even further to slow inflation.

That could affect the housing market, too.

I know, all of this is highly speculative. But my point is that you will want to watch what happens in this sector to see what could happen in the housing market in late 2017.

In good news, Phoenix is expected to be the top market in the country in 2017. I take this with a grain of salt, as you might guess.

“We don’t expect the outcome of the election to have a direct impact on the health of the housing market or economy as we close out 2016. However, the 40 basis points increase in rates in the days following the election has caused us to increase our interest rate prediction for next year,”   –Jonathan Smoke, chief economist for Realtor.com in Phoenix Biz Journal, Nov 30, 2016

We will be keeping an eye on the market and the political landscape. If you have questions about how this might affect you, give us a call at 602-456-9388.

December 2, 2016by phxAdmin
Blogroll, Live, Market Analysis

December 2016 Phoenix Market Update

December 2016 Market UpdateThe December 2016 Market Update is based on the latest numbers from November. Our friends at the Cromford Report provide us with the most reliable data to share with you.

“After the usual summer lull, pricing has regained a lot of upward momentum over the last 2 months. However that upward momentum is petering out now and increases in the rest of the year are likely to be modest. Nevertheless it still seems probable that will see the highest average price per square foot for 2016 posted during December.

For the monthly period ending November 15, we are currently recording a sales $/SF of $145.44 averaged for all areas and types across the ARMLS database. This is up 1.8% from the $142.84 we now measure for October 15.

On November 15 the pending listings for all areas & types shows an average list $/SF of $147.84, up 0.2% from the reading for October 15.

Our mid-point forecast in the December Market Update for the average monthly sales $/SF on November 15 is $145.81, which is 0.2% above the November 15 reading.

Currently we are seeing additional supply arriving for the West Valley, especially Surprise, while supply in parts of the Southeast Valley is becoming tighter, especially in Chandler. On its own this change is likely to cool average pricing a little because the future sales mix will slightly favor the cheaper homes in the West Valley which sell extremely quickly.”

What does this mean for you? Well, I think prices will continue to rise, generally, and specifically in the CenPho and historic neighborhoods. There are few new houses being built in this area and people still want to live more centrally.

While there is increased pressure on the Federal Reserve Bank to raise interest rates, especially with news that we just hit the lowest unemployment rate in 9 years on December 2nd, even a one-point increase in interest rates probably won’t slow that demand. We are already at historically-low levels. So, we would be at “historically low + 1%.”

So, if you are looking to sell, I would do that between January and June, before any possible negative outcomes from an aggressive Trump immigration policy might take hold. Plus, that is the busiest time of the year. Please see my post on that issue, here.

If you are looking purchase, I would do that sooner, rather than later. If prices are going up and interest rates are going up, you could get hit with a double-whammy.

Give us a call and we can help you build the best strategy, 602-456-9388.

December 2, 2016by phxAdmin
Blogroll, Life, Live, Market Analysis, Public Policy

Waiting for the Election to Purchase?

Ship in stormSo, were you waiting for the election to purchase a home?

Well, the election is over and people are asking me whether its safe to purchase a home, or whether we should expect market turmoil under our new president.

They’ve seen stories like this one from the Arizona Republic, which speaks to scarcity in the housing market and makes a tenuous tie to the presidential election.

Here’s another article from Slate indicating that people have been putting off major buying decisions due to the election. While I’m sure some people have held off on major decisions, we have not seen that among our clients. We’ve been busy!

Even so, if folks have been waiting for the election to decide until now, we will know it in about a month. If monthly sales numbers bounce, then you will know that people are re-entering the market. I’ll look back in about a month and let you know what we see. If you are inclined to believe that people have been waiting to act, then you will want to act before that bounce happens.

More than anything, let me put these fears to rest: the real estate market is not likely to undergo some serious upheaval any time soon.

First, here’s some advice that I found to be accurate in this article, which really points to how short-term fears about a presidential election might benefit a few, but are not a good reason to act quickly for most. Here’s the key take-away quote:

“I don’t think it’s a wise idea to try to time any markets, especially housing,” says real estate expert Kurt Westfield at WCE Equity Group. “Housing markets are very localized, subject to microeconomic shifts. The election takes place on a much larger macroeconomic scale.”

Second, let’s talk about the nature of the real estate market and why you should not act in haste. Nor should you hold off if you need to buy or sell. In other words, just act on your housing needs as they are today.

The most important thing to keep in mind is that the markets move very slowly. I know. It did not feel that way in 2008 when people’s homes seemed to lose value in months. But, when you look at that data, it still took months, not days or weeks for major movements to take place.

Sure, you will see small changes around the end-of-year holidays when people are focussed family and parties, but that’s an annual deal and does not change the market too much.

The thing you should most be aware of in the short term (3-6 months) is interest rates. While they are still historically low and probably won’t jump too quickly, a one percent increase represents a lot of money over the life of a loan. We know that the Federal Reserve Bank is talking about interest rate increases, so we encourage you to speak with your lender about what he or she is seeing.

In other words, don’t hit the panic button on interest rates. Just keep an eye on it. Make your decision based on what you need when you need it.

Let’s turn for a second to the long-term view (18 months to 2 years) just so I can make one point about Donald Trump’s threats to deport 11 million people. If his threats are carried out in whole or in part, then you will definitely see a major hit to our real estate market, according to Tina Tamboer of the Cromford Report.

I want to be careful here and temper that previous comment. That is IF he can forcibly deport people or IF they choose to leave on their own. And even then, the affects would be seen 3-6 months after he takes action.

According to Tina, we would see a dramatic increase in supply of homes (as people move away) at the same time we would see a huge reduction in demand (as immigrants would no longer purchase homes). Yes, immigrants own homes.

But this would also impact those folks who own rental properties. Many of whom voted for our next president. Further, according to Tina, the impact would not be localized to certain neighborhoods. The impact would be valley-wide.

In the even longer term, according to Tina, Arizona’s population is aging quickly and we don’t have younger people to replace the aging population who can afford to purchase homes.  Otherwise in the next 15-20 years we will have a huge excess of homes and prices will depress significantly.

This means that we need to find some solution to the immigration issue, which allows immigration in to Arizona.

You know, the very thing that the next president ran against.

We can help you make the right decision on your sale or purchase. Contact us at 602-456-9388.


November 11, 2016by phxAdmin
Page 5 of 25« First...«4567»1020...Last »

Subscribe to Our Newsletter

We keep your data private and share your data only with third parties that make this service possible. Read our Privacy Policy.

Thank you! Please check your inbox or spam folder to confirm your subscription.

Categories

  • Art
  • Blogroll
  • Design
  • Editor's choice
  • Events General
  • Events GYP
  • Fashion
  • Featured
  • First Time Home Buyer
  • Homes
  • Life
  • Light Rail
  • Live
  • Market Analysis
  • NeighborhoodVideos
  • Phoenix News
  • Photography
  • Photoshootings
  • Profiles
  • Public Policy
  • Renovation
  • Renting
  • Restaurant Reviews
  • Sustainable Living
  • Tips
  • Uncategorized


© 2015 copyright GET YOUR PHX ® // All rights reserved // Privacy Policy