Get Your PHX - A Whole New Way to Experience Phoenix
  • Home
  • Our Blog
  • About Us
  • Contact
Get Your PHX - A Whole New Way to Experience Phoenix
Home
Our Blog
About Us
Contact
  • Home
  • Our Blog
  • About Us
  • Contact
Blogroll, Live, Market Analysis

April 2018 Market Update

We are watching a hot market for the April 2018 Market Update.

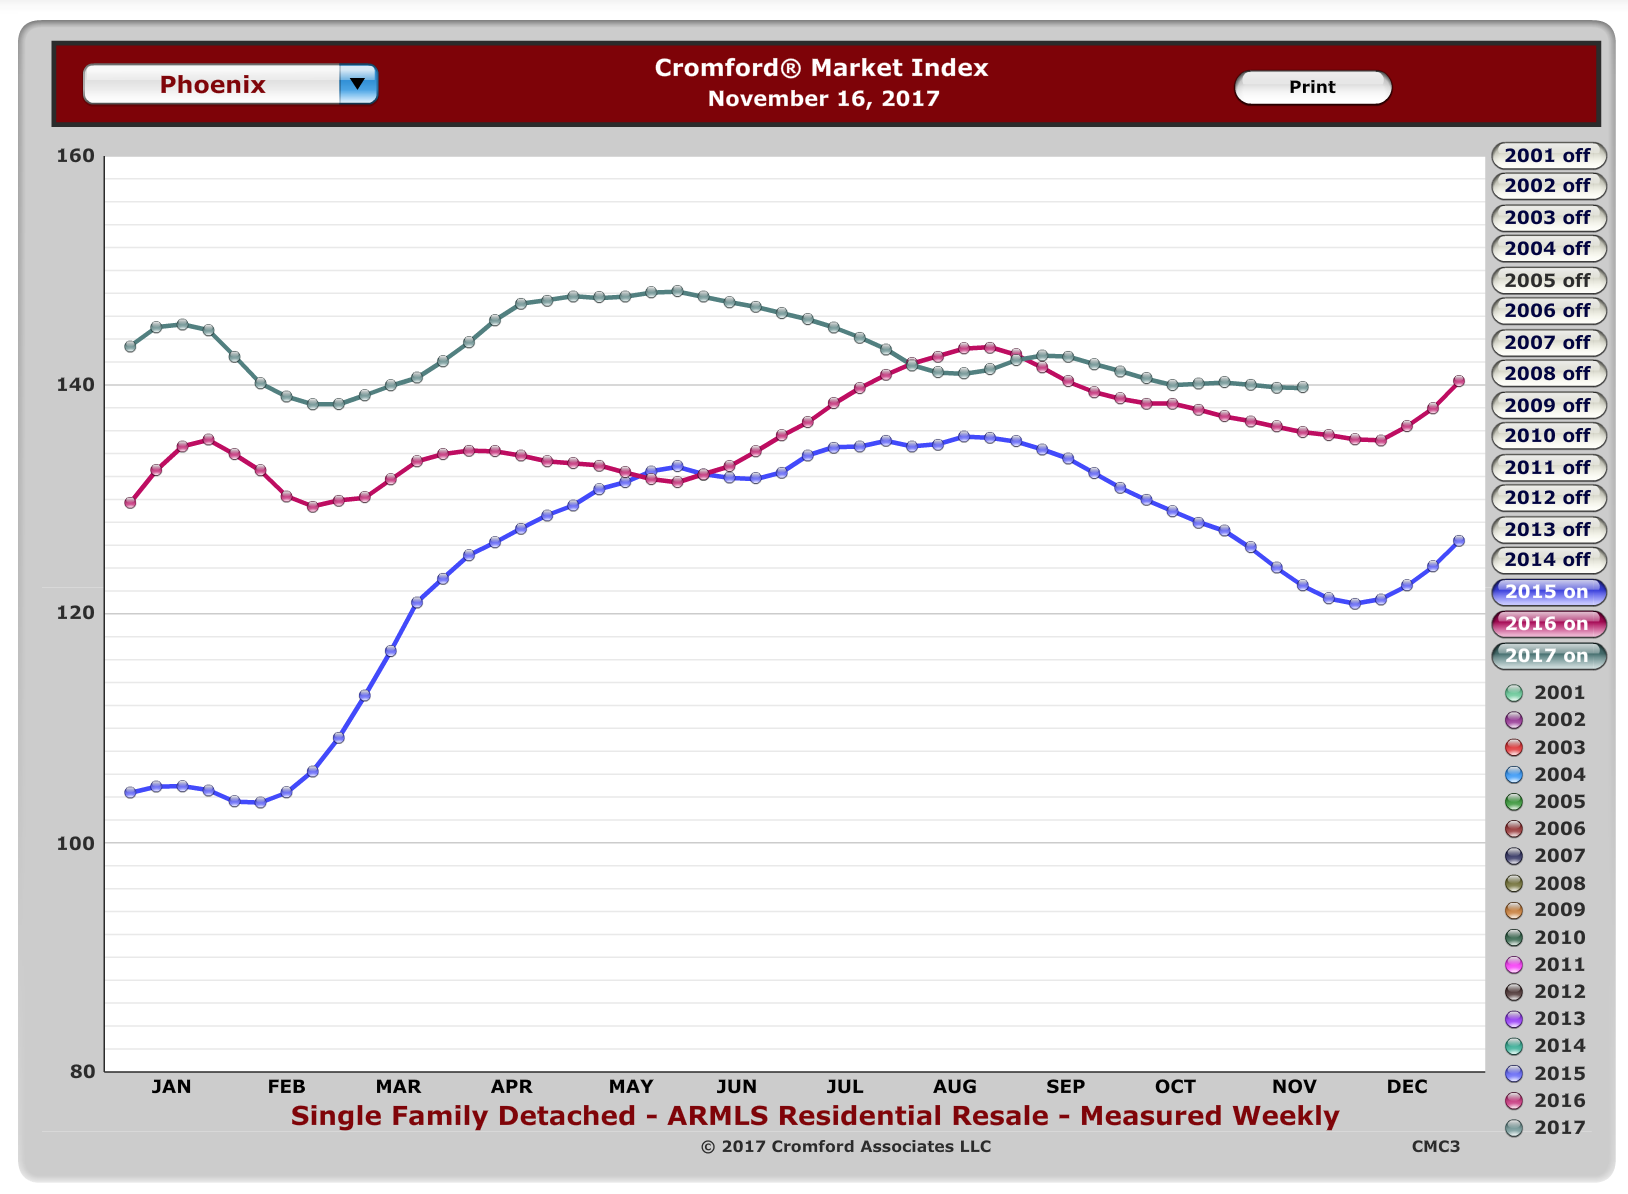
First, here’s the perspective of the numbers crunchers over at the Cromford Report:

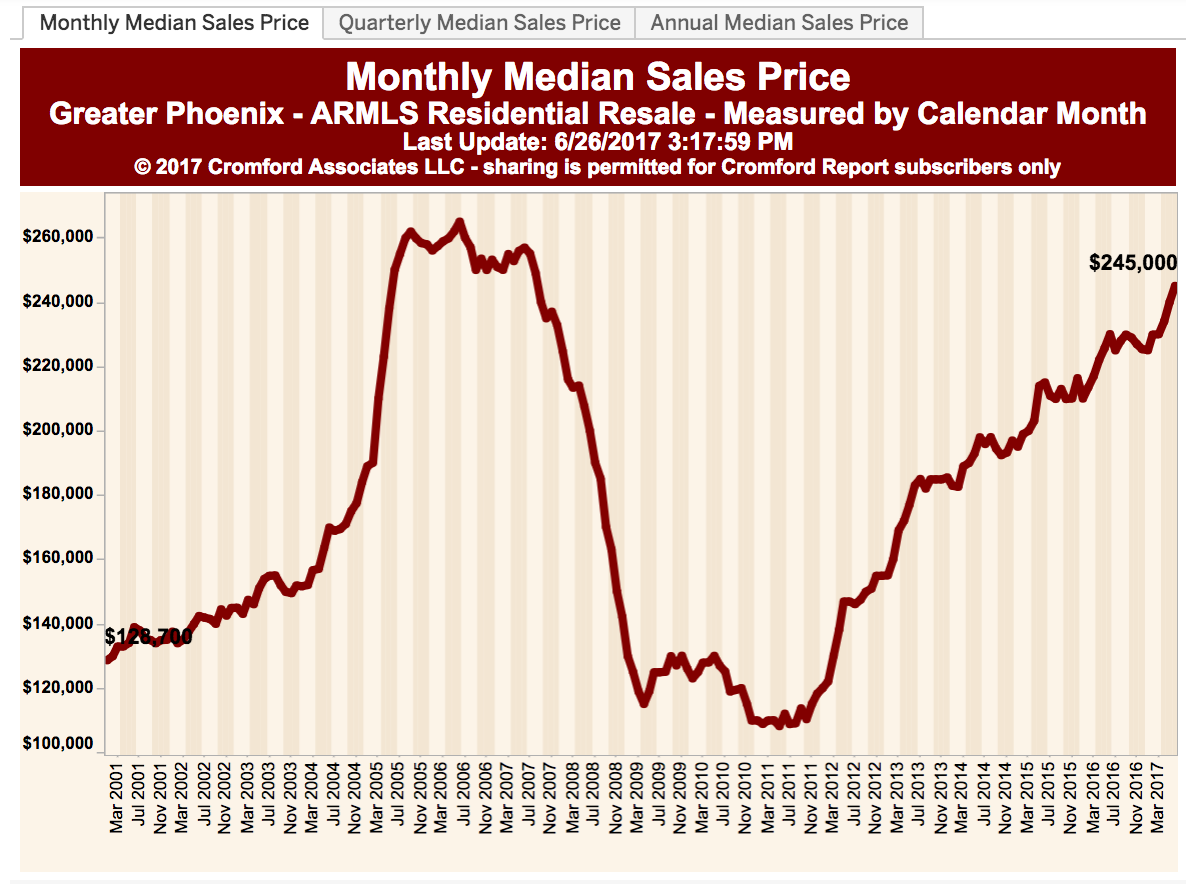
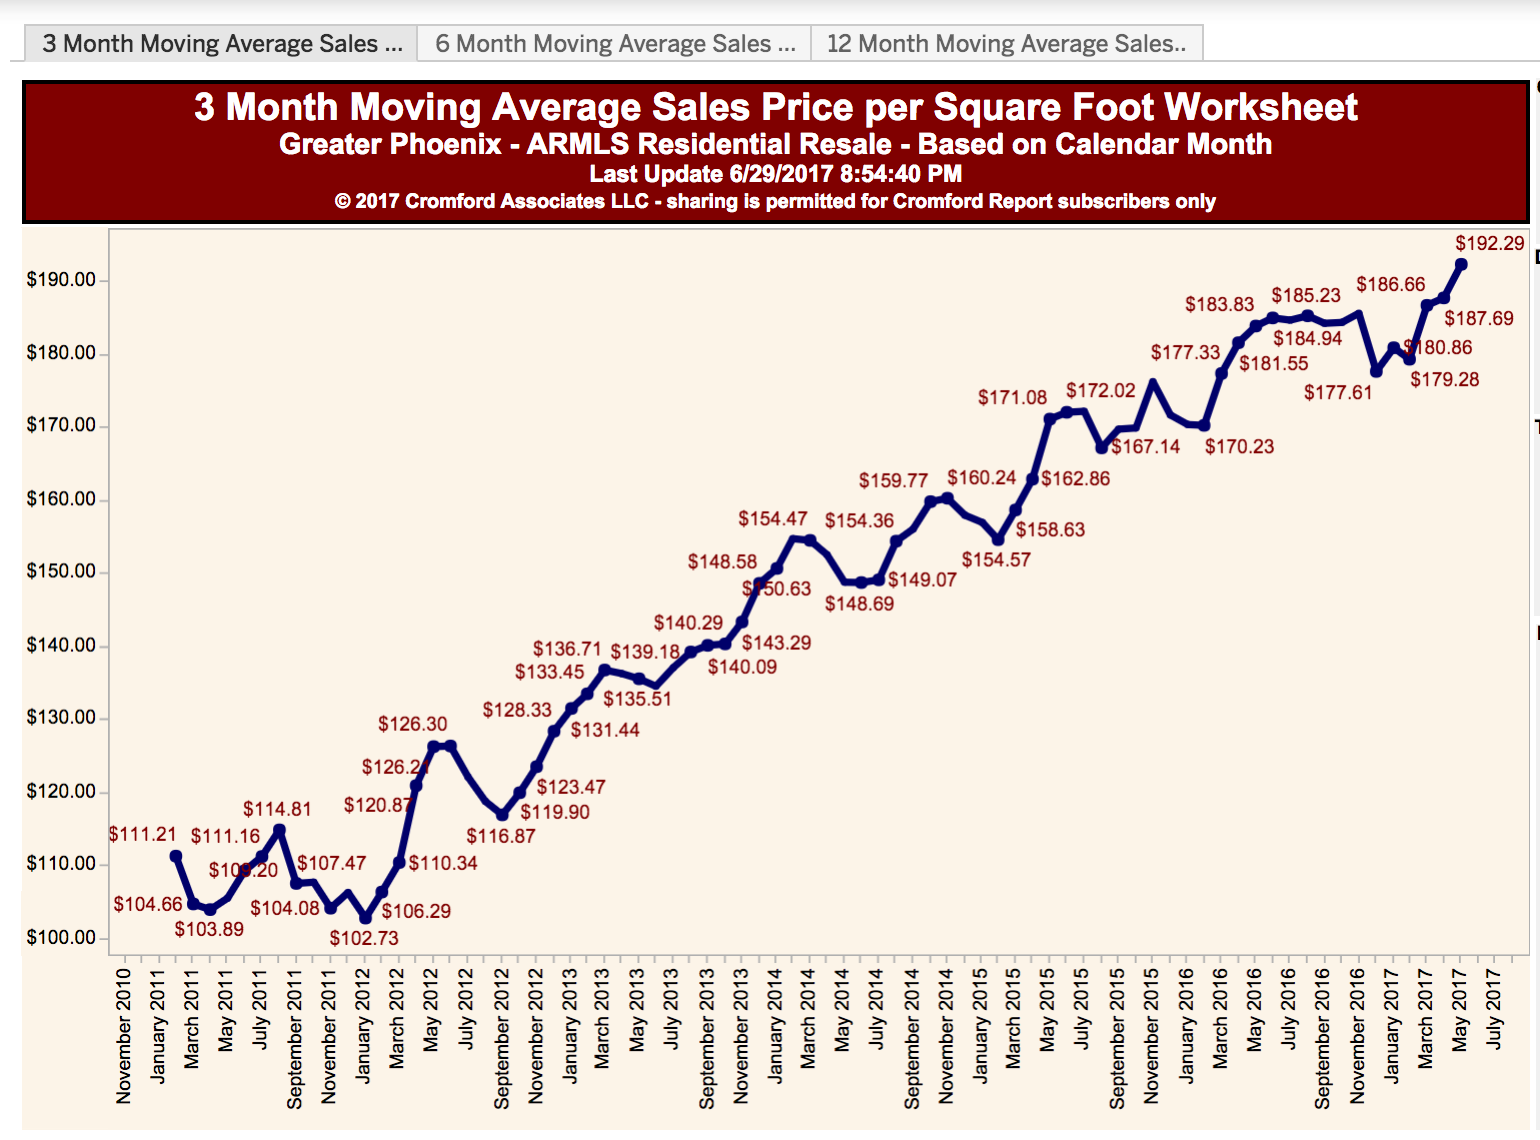
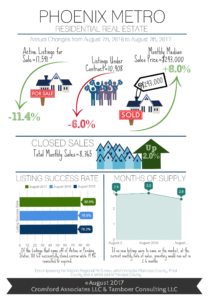
For the monthly period ending March 15, we are currently recording a sales $/SF of $159.67 averaged for all areas and types across the ARMLS database. This is up 0.3% or $0.55 from the $159.12 we now measure for February 15. On March 15 the pending listings for all areas & types shows an average list $/SF of $166.06, up 1.5% from the reading for February 15.

Translation: the market update shows  that county-wide averages for prices continue to inch upward, but not at a dramatic pace.

The CenPho and historic markets, more narrowly defined, are active, but not what Cromford would consider “hot”, especially at the higher price points.

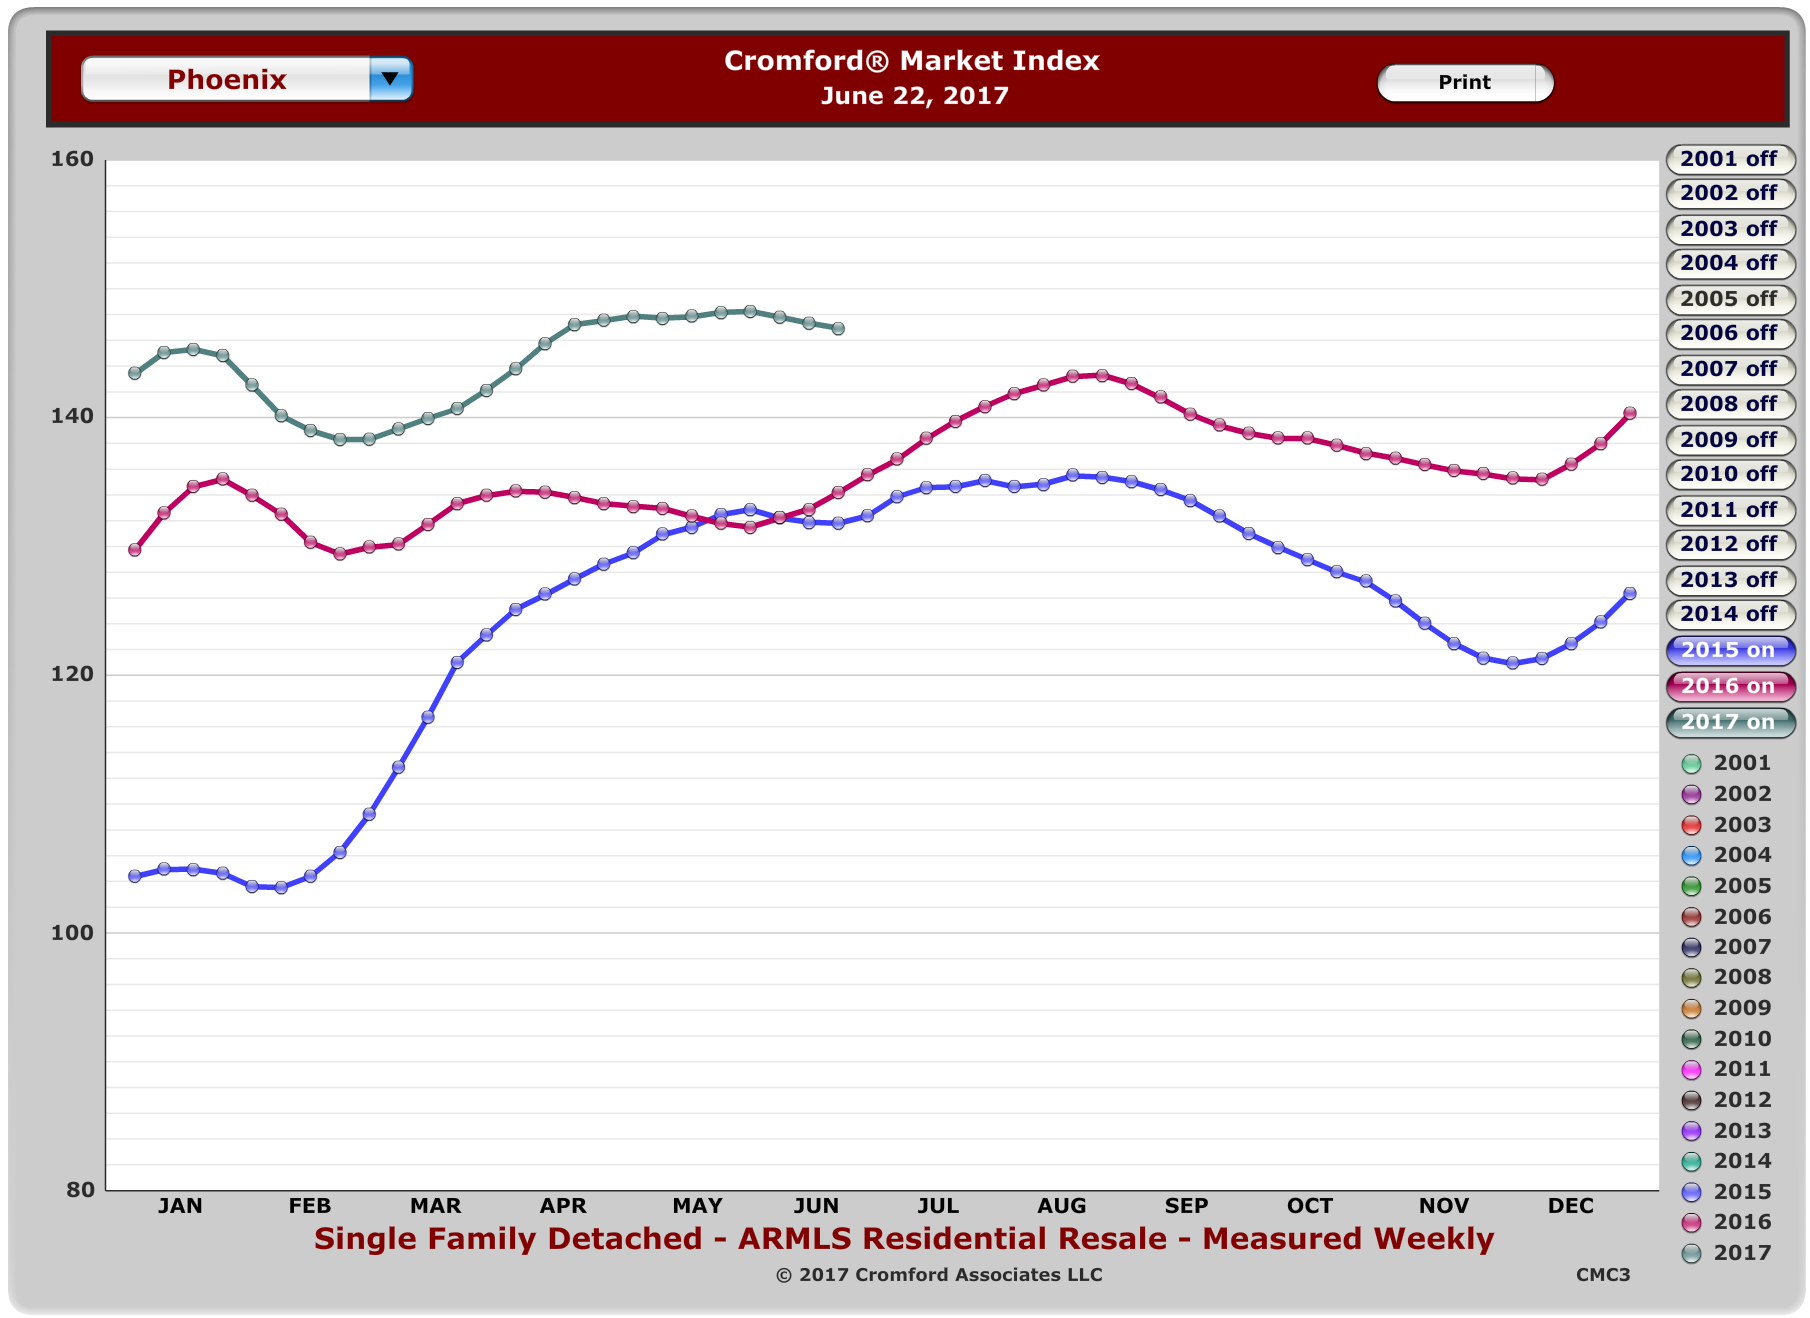
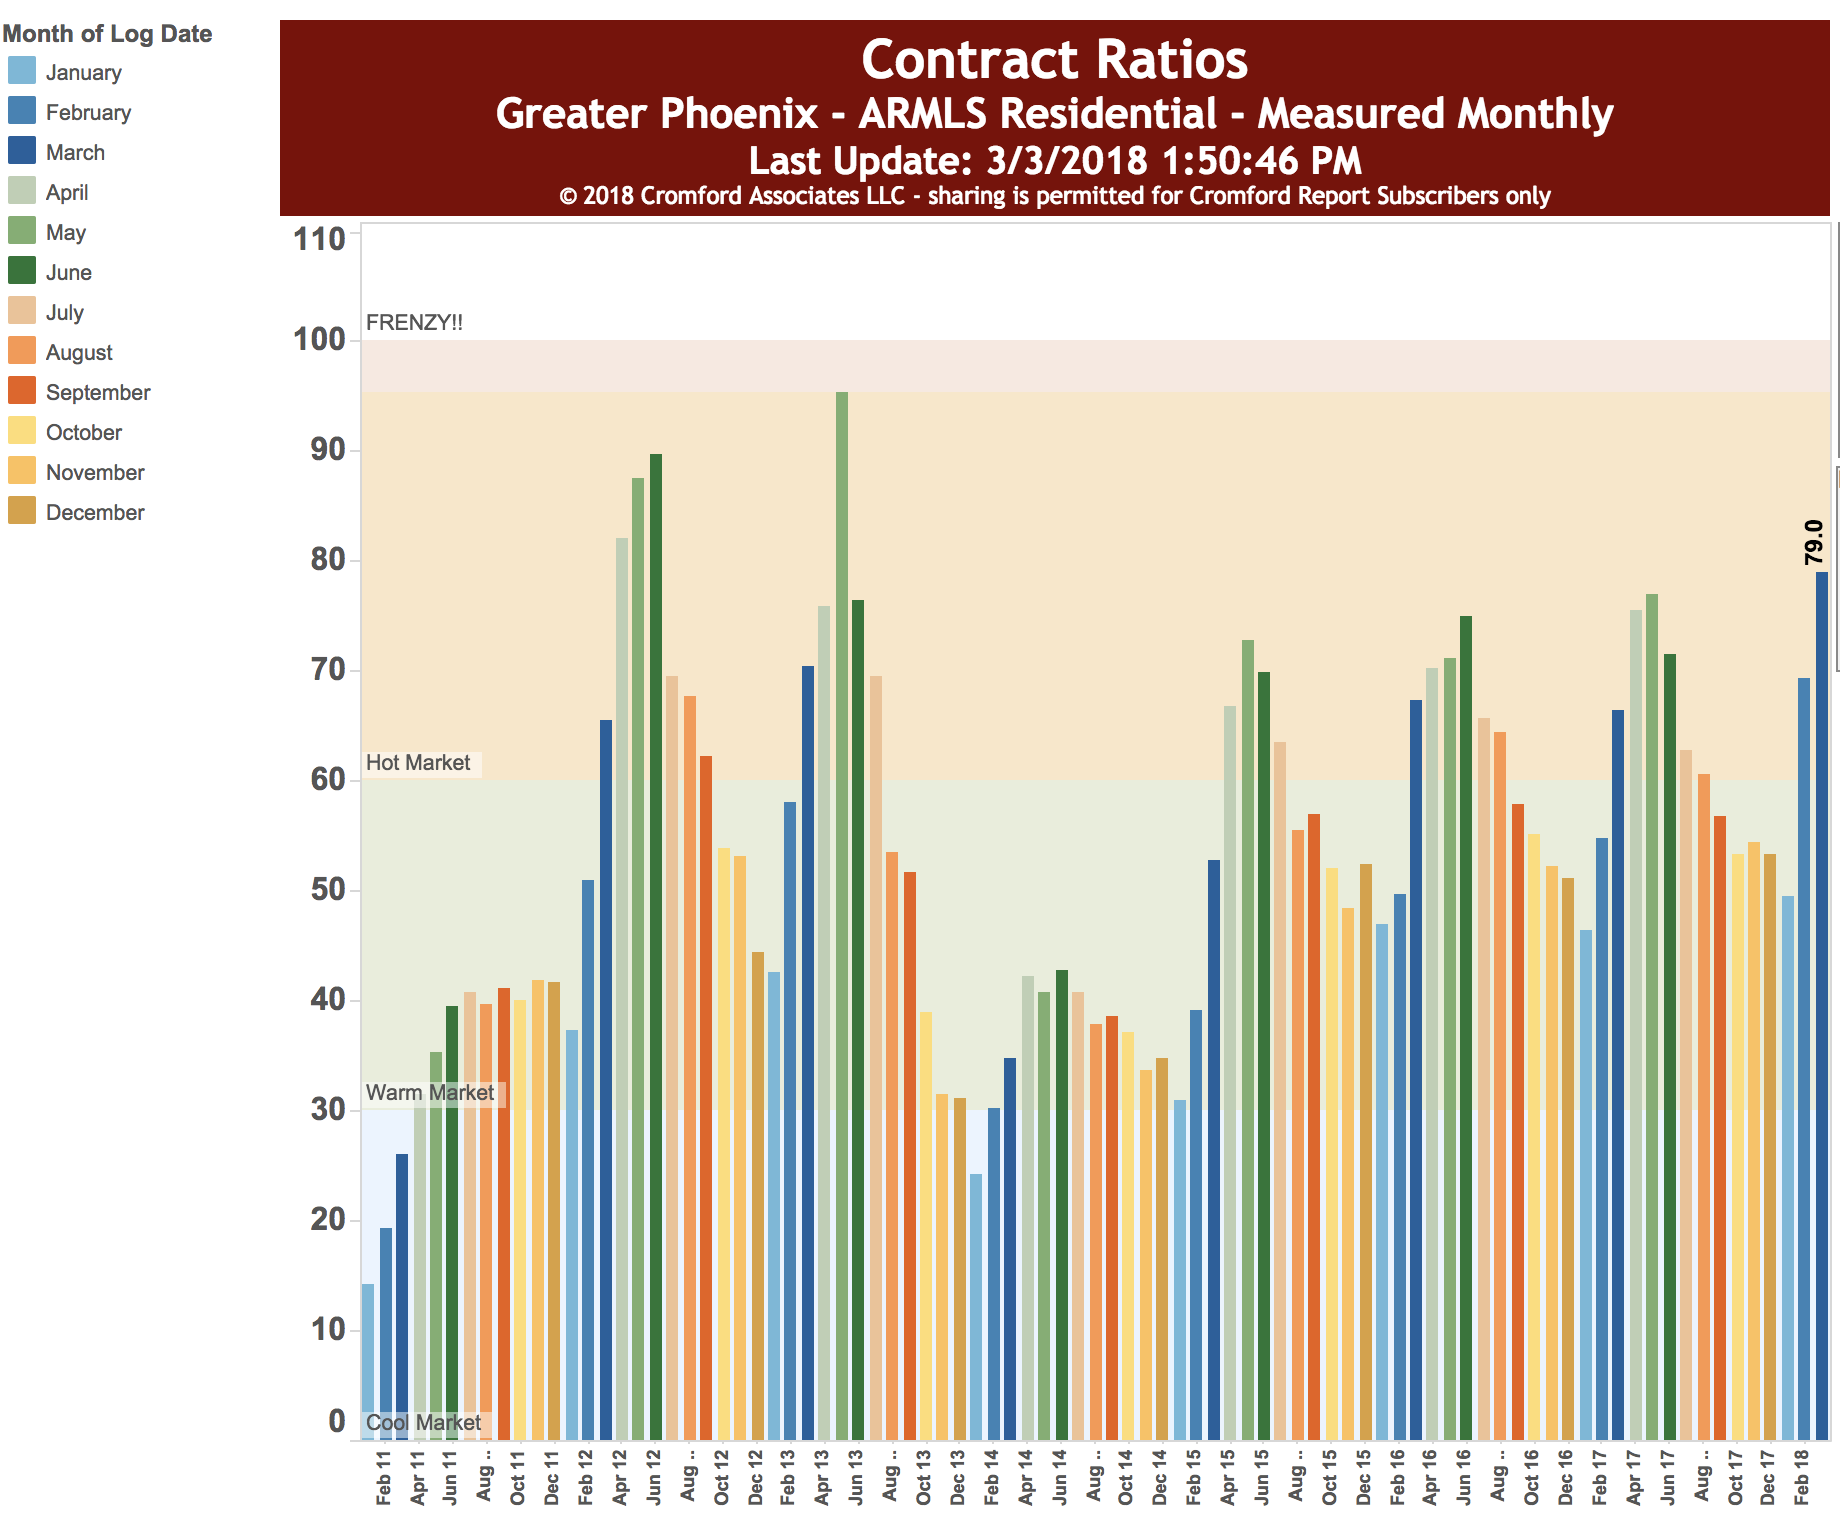
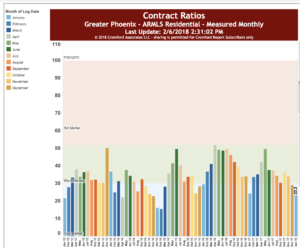
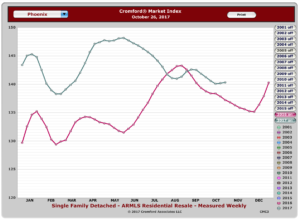
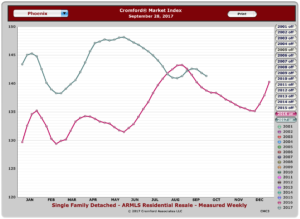
Look at these three charts measuring the “contract ratio”. Remember, the contract ratio measures the number of completed sales contracts relative to the supply of active listings.

1. Valley-wide contract ratio for single family residences, all prices. Notice that we are in the “hot market” band of the chart.

market update

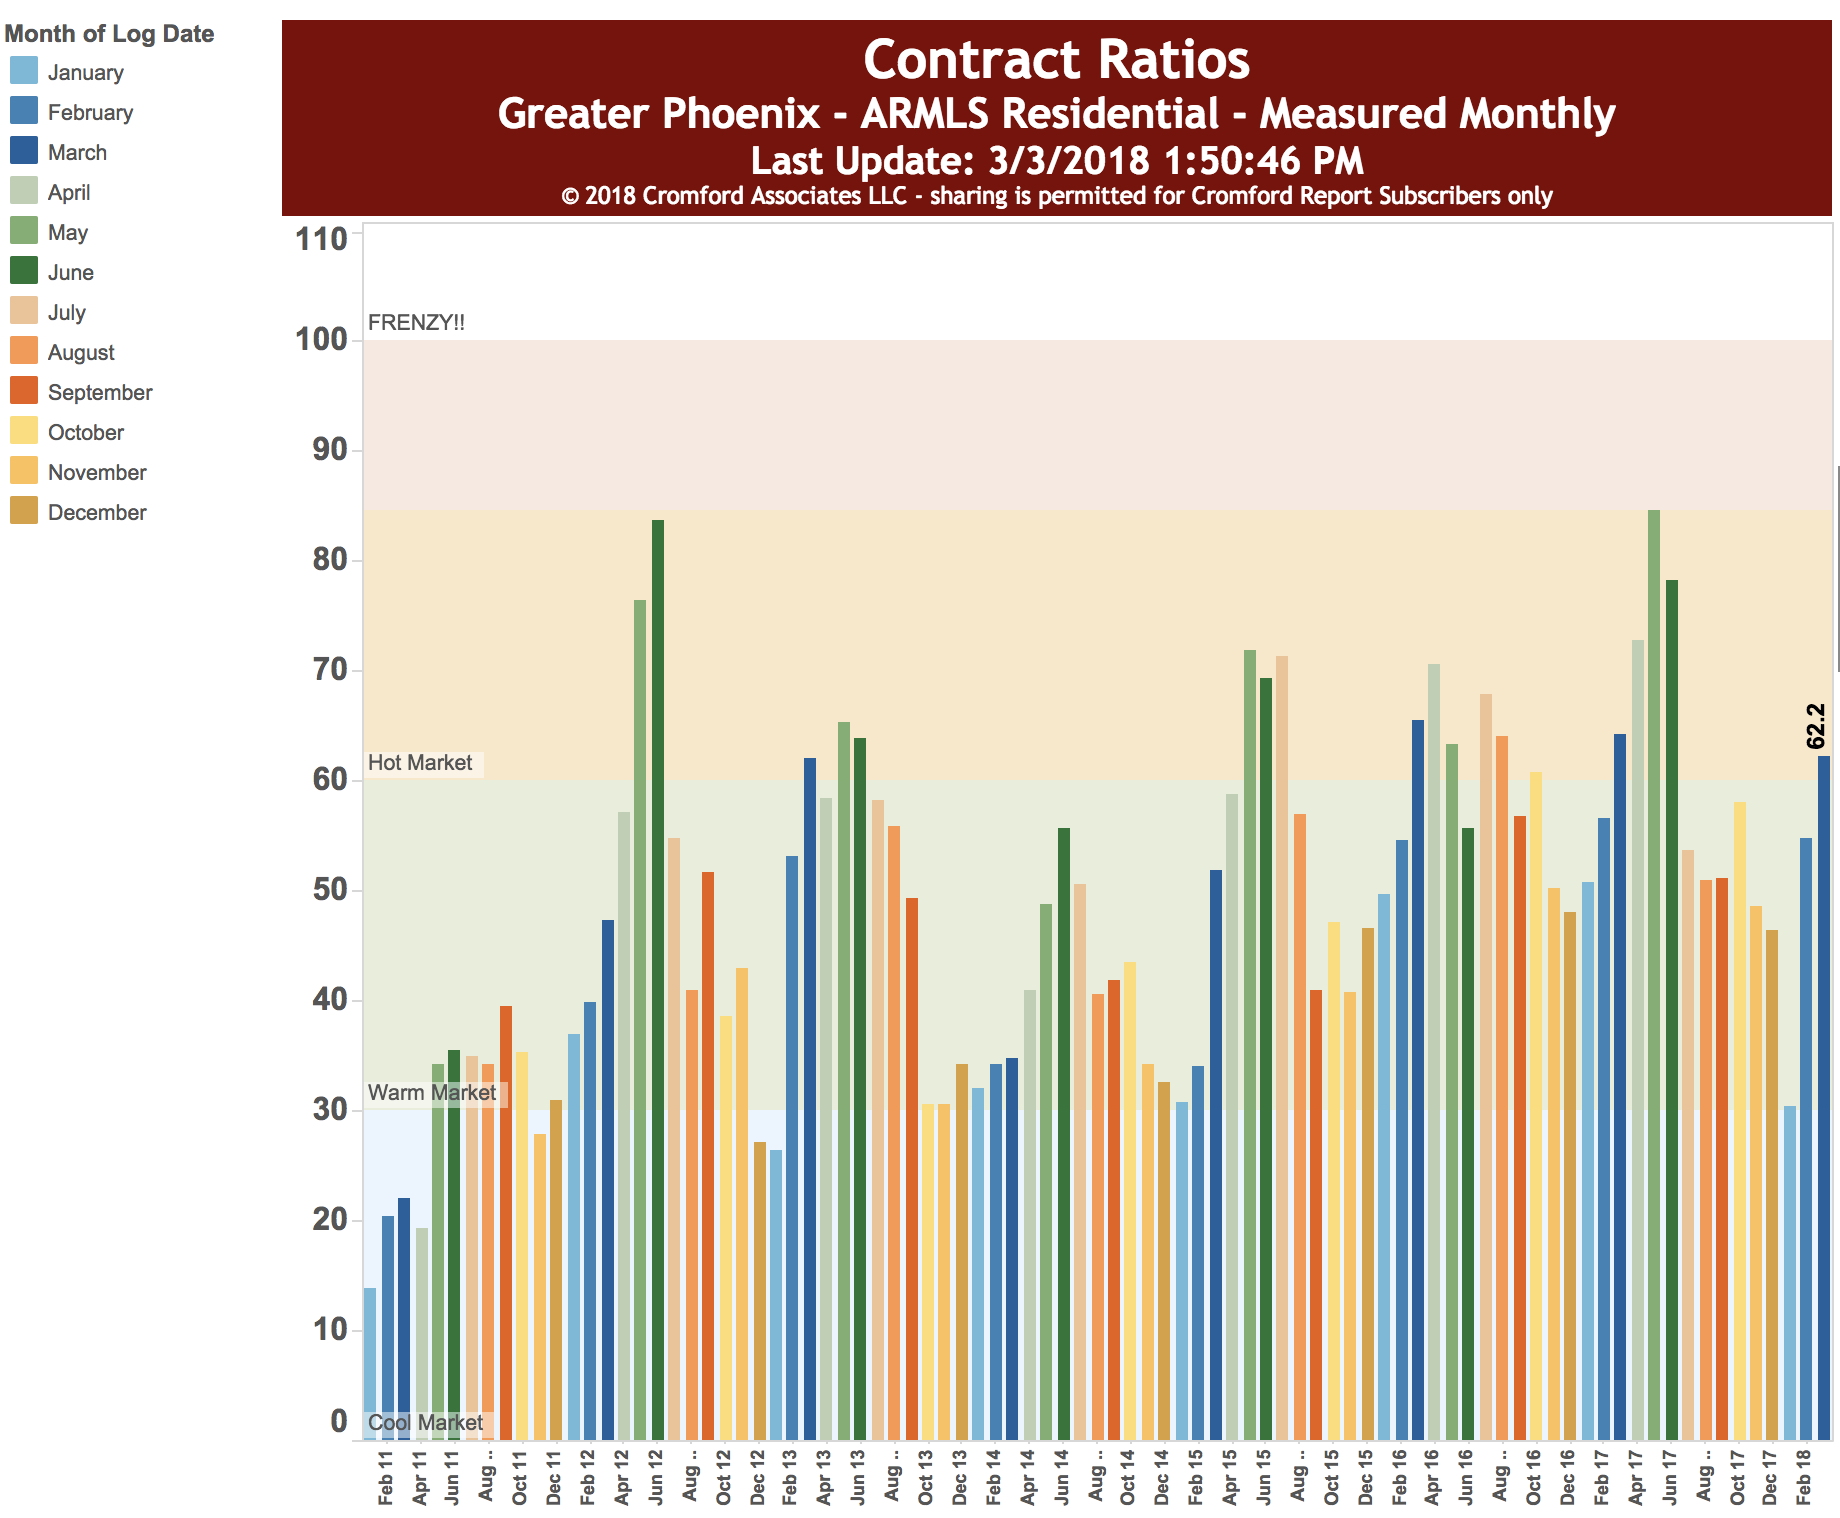
2. If we just look at Cenpho and historic neighborhoods, we go from hot to warm. Why is this, given that no new homes are being built in this area? Shouldn’t it be hot?  It may be that people have been listing a little too high for the market, and their listings are staying on longer, or are dropping off. This is true, wether we are looking at all homes (52.6%) or just homes below $500,000 (62.2%)

market update

3. If we look at Cenpho, historic, same area and above $500,000, we see that the Contract Ratio drops to about ____.  It is normal for more expensive homes to take longer to sell and for more of them to drop out of the market. So, this is not alarming.

market update

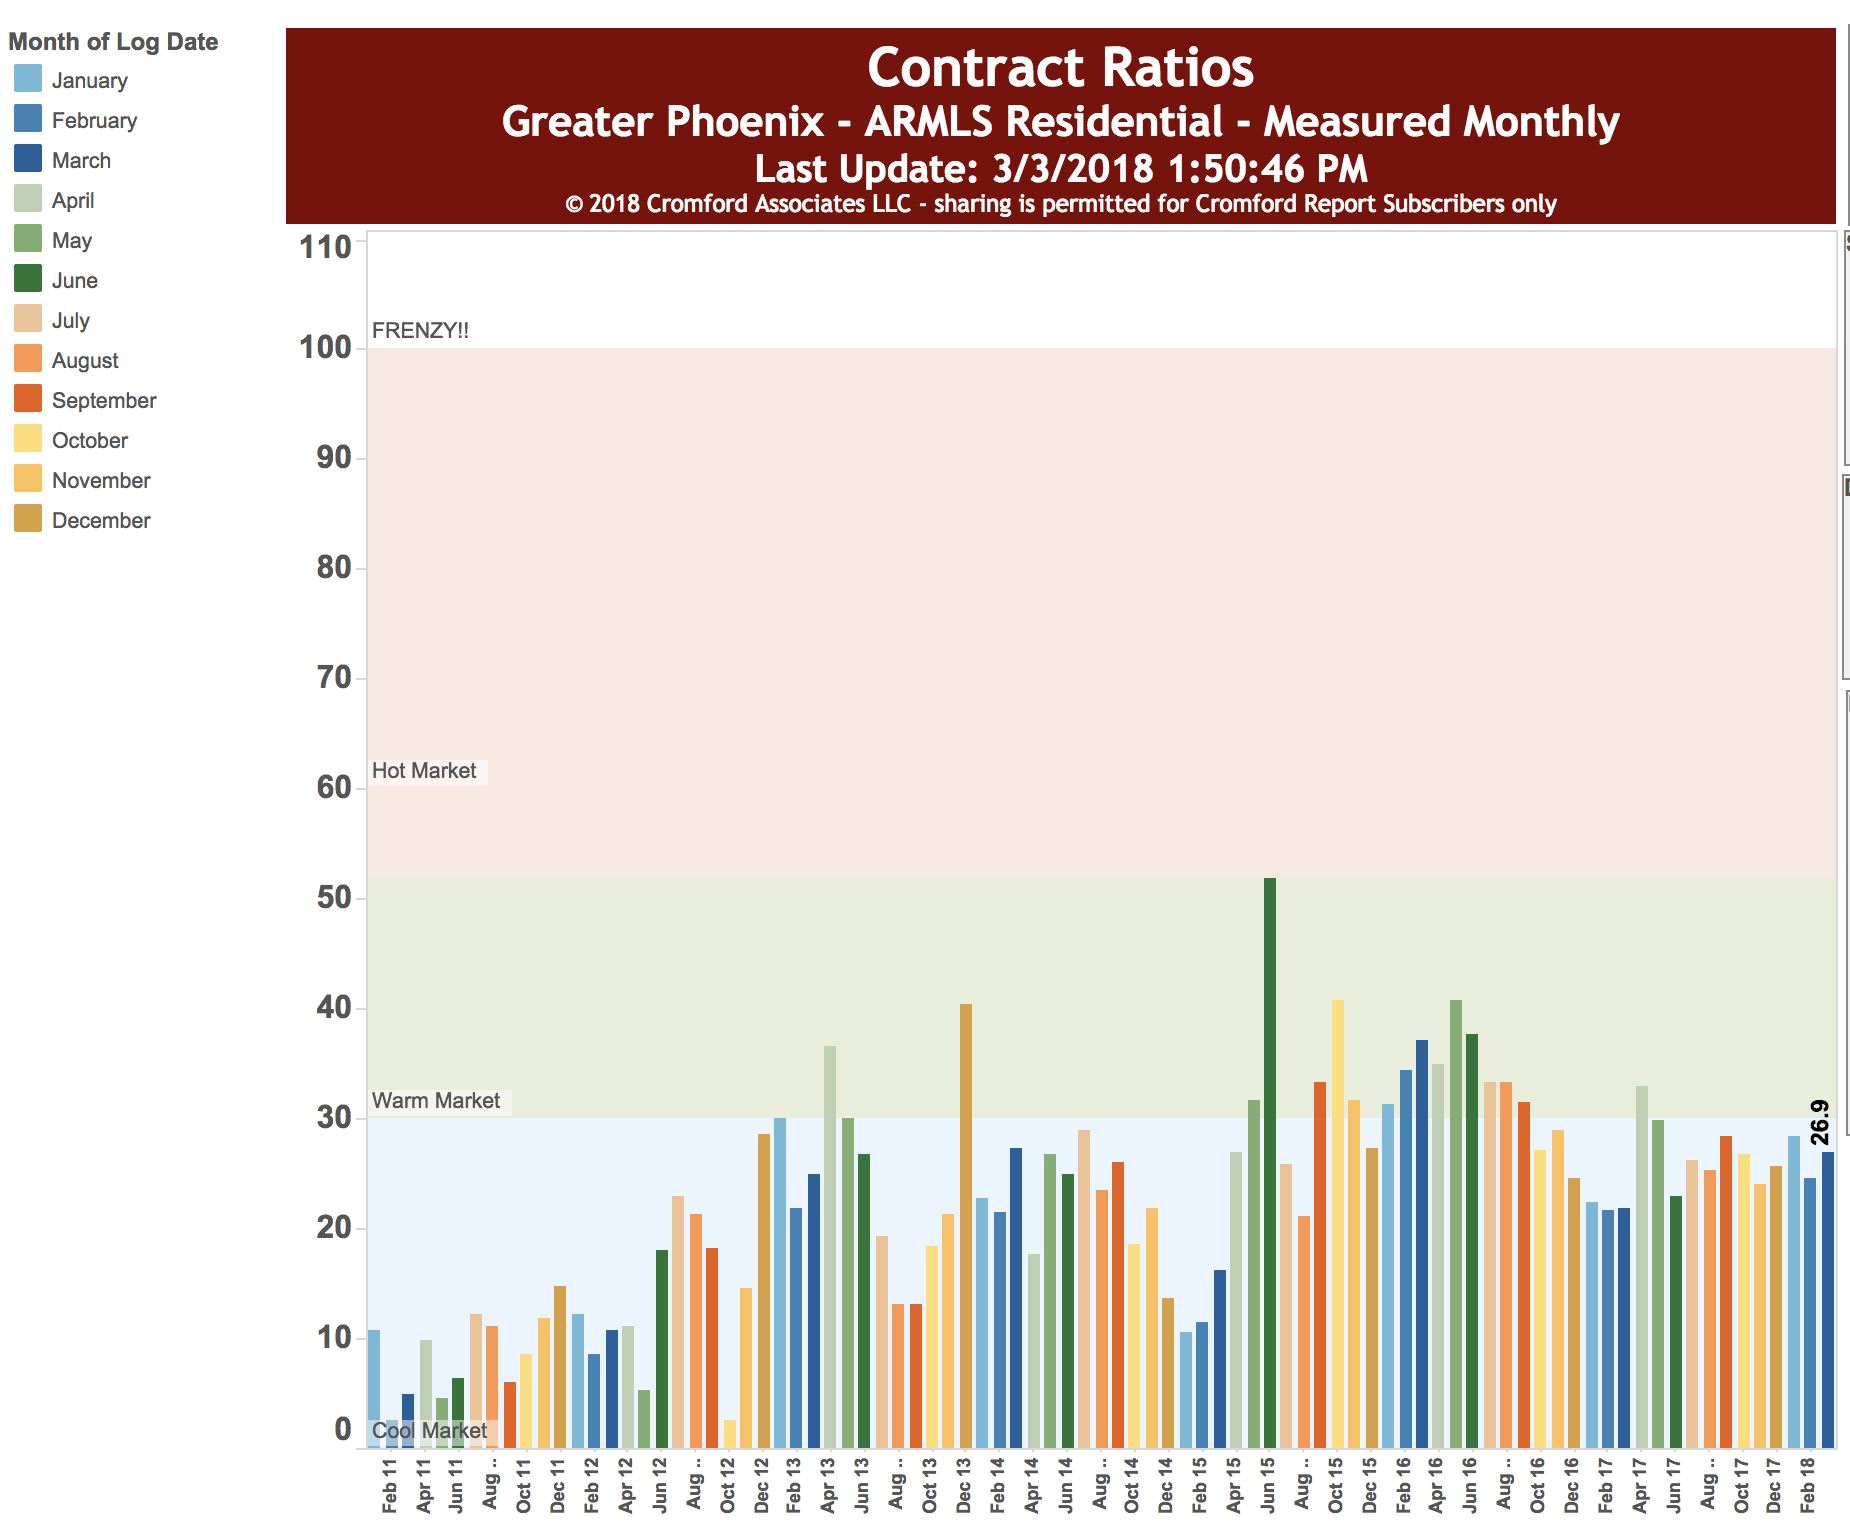
What it does seem to show is that the historic markets, while active, are not as hot as the over-all county. It is hard to say why –and perhaps the wonderful nerds at the Cromford Report would disagree– but I believe it may be that sellers might have priced too high at first in the historic neighborhoods. Combined with possible uncertainty on the part of buyers about whether they should buy now or wait for a market shift.

While I’ve been expecting a market shift for some time, I’m starting to believe that it may not come as soon a I originally thought. This is probably due to two things. First, there are no new houses to speak of in CenPho. Second, with a high stock market, people are still looking to real estate as a place to park their money.

We are watching the market closely. If you are thinking of buying or selling, use a team that knows the numbers. Call us at 602-456-9388.

March 30, 2018by phxAdmin
Blogroll, Live, Market Analysis

March 2018 Market Update

I’m at odds with my friends at the Cromford Report in this March 2018 Market Update.

I wish I weren’t.

They are seeing a continued upward trend in prices, although slight.

I’m seeing the beginnings of a shift.

First, their comments:

“For the monthly period ending February 15, we are currently recording a sales $/SF of $159.13 averaged for all areas and types across the ARMLS database. This is up 1.0% or $1.53 from the $157.60 we now measure for January 15. Our forecast range midpoint was $159.14, with a 90% confidence range of $155.95 to $162.31. The actual result was just 1 cent below the mid-point, which means the forecast we gave last month was our most accurate ever.

We are therefore predicting a similar rise over the next 28 days to the one we just experienced between January and February. So far in 2018, with a month and a half of new listings to go on, we have seen a 1.5% decline in new supply over the same period in 2017. Obviously this not going to rebalance the market in favor of buyers. Prices will continue to trend higher until we see either far more supply or much lower demand.”

Second, what Michelle and I are seeing:

In speaking with other agents and in our recent experience, we are seeing less activity above $300,000. Below $200,000 is as hot as ever.

The Cromford Index shows a continued upward climb. There was a bit of a dip a month ago, which I reported. But it is turning around.

However, we are seeing a slightly lower contract ratio. “The contract ratio indicates how “hot” a market is. It specifically measures the number of completed sales contracts relative to the supply of active listings. The higher the number the greater the buying activity relative to supply. If this number rises then it is a sign of growing contract activity and a positive signal for sellers.

Conversely a falling number is a sign of a weakening market – either supply of active listings is increasing or contract activity is slowing, or both. In a balanced market for normal market segments, the value of the Contract Ratio is usually between 30 and 60.”

Call me paranoid, but I think we are due for some sort of a correction. The only caveat is that this may be less pronounced in a dense urban area, such as right downtown.

Here’s where I could be wrong: the contract ratio often pushed back upward in February and March. I say, if we don’t see that happen when we get the numbers this month it may be a sign.

If you are thinking of selling, let’s get it done right away and let’s be ready to price aggressively.

Call us at 602-456-9388 and we can help you navigate the market.

February 28, 2018by phxAdmin
Blogroll, Live, Market Analysis

December 2017 Market Update

December Market Update

The December Market Update comes at a time when we are seeing a lot of interest in listing homes. We seem to be getting a new call or email every few days from people who want to list in the new year.

Does this mean that we are in a bubble? I don’t know. See last month’s Market Update to see why I think the market could be turning a little in 2018.

The Arizona Republic reported last week that we are definitely NOT in a housing bubble right now.

I agree.

But that does not mean that there won’t be a correction. First, we are not in a bubble because (1) we are not seeing unrestrained debt-loading like we did in 2004-2007 and (2) there is still a strong demand for new housing, especially in CenPho where there is hardly any new owner-occupied construction.

Second, a correction does not necessarily mean that the market will plummet by 30%, as it did in the last decade.

What it means is that homes are priced a little too high. Again, see last month’s analysis for more on that.

My gut tells me there could be a 2% to 5% correction in 2018.

I could be wrong. I’ll admit it if I am.

The important thing to keep in mind is that we need to look at your specific case.

For instance, if you purchased a home three years ago and you are thinking of selling, it might be a good time. If there is a market adjustment in 2018, prices could be back to 2015 levels by the end of the year. Then you may have to wait another two years to sell.

If you purchased a home in 2009, you are in a great place to sell, as prices have come so far since then.

If you are thinking of purchasing, you may want to wait –unless you are in a position that any savings you have during a slight market downturn are eaten up by further renting while you wait for that correction to bottom out.

Give us a call at 602-456-9388 to analyze your specific situation.

November 30, 2017by phxAdmin
Blogroll, Homes, Live, Market Analysis, Tips

Get a Quick Comparable Market Analysis

Comparable Market AnalysisNew to the Get Your PHX website is an instant CMA for your home, or Comparable Market Analysis.

It is simple. Just put in your address and we will do a real analysis for you (no automated, impersonal robots here). Then we can get together and refine that Comparable Market Analysis to account for specifics of your property and your neighborhood.

This is a good time to add a note about the estimates that you can get from those mega sites like Zillow, Realtor.com and Trulia.

They are wildly inaccurate in my experience. Let’s just put it on the table. Because these sites don’t have access to every Multi-Listing Service around the country, they depend on assessor records and property tax records. Property taxes are a reflection of assessors estimates of values, not of sales information.

In fact, there is an on-going debate about what impact these estimates are having on home owners. Here’s an article on the issue from a couple years ago.

Fun fact: Zillow calls them “zestimates” because they can’t legally call it an estimate. We agents can’t even call it an estimate. Unless I am an appraiser, I can only give you a comparative market analysis, or a “comp.” If you want more accurate analysis, let us do a Comparable Market Analysis for you, which is based on the actual Multi-listing Service in Phoenix –not some algorithm based on property tax records.

Another fun fact: Zillow, Realtor.com and Trulia are not in business to help you find a home or sell a home. They are in business to sell realtors like me ad space for folks like you to see while you are on their websites.

Call us at 602-456-9388 for quality analysis and more fun facts.

October 31, 2017by phxAdmin
Blogroll, Homes, Live, Market Analysis

McKinley Row

I toured Matt Seaman’s new development, McKinley Row on 4th Ave and McKinley (MetroWest Development).

First, I’m a big fan of Matt. He is one of the few developers in downtown who is focusing on owner occupied properties on in-fill, walkable parcels. While most other large developers can’t get their heads out of the 1,000+ unit mentality, Matt knows that the future of development will be in finding ways to fill in the many small spaces in Phoenix.

Did you know that 43% of Phoenix is made up of empty lots? Let’s use those for housing, rather than sprawling out in to our beautiful desert, thus causing longer commutes and more pollution.

Matt and I were talking about how the Phoenix push to build apartments over the last ten years crowded out those who want to build owner-occupied properties, but also made it difficult for moderate income folks to afford to live downtown. Part of the problem comes from the investors, who don’t like to back condo projects due to potential lawsuit liability issues.

But, I digress. In short, we have a problem in housing and we need more folks like Matt who can build owner-occupied homes and who can find lower cost ways to build homes for folks in dense urban areas.

I’m not one of those agents who believes that everybody should own a home. But, at last count, there was at least a 6 to 1 ratio of apartments to owner-occupied downtown. Where will all of those renters go in a few years when they want to buy a home and they are priced out? Who will have a stake in our downtown if they all move out?

I wanted to share with you Matt’s project. With 18 town home units at 4th Ave and McKinley, and a similar project coming next year at 2nd Ave and McKinley, Matt is creating homes for downtowners.

Matt tells me that McKinley Row is half sold now, with town homes selling as low as the $390s and as high as the $500s.

Have a look at the photos below. They are just my photos. If you want to see the snazzy photos with the CGI furniture in the rooms, have a look at their website.

The photos below illustrate a few features that I thought were unique.

If you are interested in town house living, please give us a call at 602-456-9388. We’ve represented clients on Matt’s projects before, so give us a call.

McKinley Row

MetroWest did a good job of setting back the projects, as required by historic preservation. They’ve left green space and space to enjoy the neighborhood.


McKinley Row

These are the massive windows in the corner unit, which you can see from the inside in the next photo. Great views of downtown!


McKinley Row

Here are those windows from the inside. That’s a nice view to wake up to.


McKinley Row

I did not get a shot from the outside, but this corner unit, in addition to having corner windows on the ground floor, has a separate entrance that you can make in to an office.


October 31, 2017by phxAdmin
Live, Market Analysis

November 2017 Market Update

I don’t have a crystal ball for this November 2017 Market Update.

I don’t know what is going to happen in the market in 2018.

But I do think it is wise to consider the probabilities. I do think that there will be some kind of market shift in 2018. It may only be 3 to 5 percentage points, but I think the changes are increasing every year.

Why do I say this? First, I’ve heard professional economists saying that the over-all economy is due for an adjustment.

Second, I’m seeing the Cromford Index shifting downward from end of last year.

For you long-time readers, you will remember that the Cromford Index tracks whether we are in a buyer’s market or a seller’s market, and by how much. It also precedes market shifts because prices can still be going up while the Cromford Index is trending down. If you look at the chart here, you will see that the seller’s advantage has been weakening since about May. If we see that weakness in January and February, then expect prices to drop a little bit. (Nothing like 2009, by the way.)

Third, the market is crowded with renovation homes right now. Some of them are not that great, by the way. Based on past experience, this seems to be an indication that speculators are crowding the market. When we get too many listings on the market, I think prices will begin to drop.

Fourth, the chatter out there is about quick sales. This is usually a sign of a high market. We had clients who had 15 offers in the first 48 hours of listing their property. Sound familiar?

Our friends at the Cromford Report are not ready to take a stand like this for their November 2017 Market Update. Cromford sees prices strong for next month, expects more listings on the market, which could lower prices at end of year. Here is there take:

November 2017 Market UPdate

“Each month about this time we look back at the previous month, analyze how pricing has behaved and report on how well our forecasting techniques performed. We also give a forecast for how pricing will move over the next 30 days.

For the monthly period ending October 15, we are currently recording a sales $/SF of $150.21 averaged for all areas and types across the ARMLS database. This is up $1.10 or 0.7% from the $149.11 we now measure for September 15.

Our mid-point forecast for the average monthly sales $/SF on November 15 is $152.17, which is 1.7% above the October 15 reading. We have a 90% confidence that it will fall within ± 2% of this mid point, i.e. in the range $149.71 to $155.83.

So we are forecasting the same percentage increase over the next 31 days that we have seen in the average price of pending listings over the past 30 days. This means the third quarter slump is well and truly over and we expect the usual surge in $/SF for the fourth quarter.

Having said that, the actual number of pending listings is lower than usual. Only 2001, 2007 and 2014 saw lower pending listing readings as of October 15, so it appears that the current pricing level is putting a slight damper on demand, at least as far as pending counts is concerned. Sales counts are still looking healthy although the annual sales rate is no longer increasing as it had been a few months ago. This means the market is not expanding as fast as as it was in the first half of 2017. (Emphasis added)

If you are thinking about selling your home, it is a good time to have a deeper look at the data. Give us a call at 602-456-9388 so we can plan ahead and maximize your sale price.

October 31, 2017by phxAdmin
Live, Market Analysis

October 2017 Market Update

For the 2017 Market Update, we get some help from the Cromford Report. First, here’s their over-all market analysis. Followed below by my more localized analysis of what we are seeing.

“For the monthly period ending September 15, we are currently recording a sales $/SF of $149.06 averaged for all areas and types across the ARMLS database. This is down 11 cents or 0.07% from the $149.17 we now measure for August 15.

On September 15 the pending listings for all areas & types shows an average list $/SF of $153.13, down 0.7% from the reading for August 15.

So we are forecasting another small decline over the next 30 days. (emphasis added) This is slightly unusual since we normally start to see some upward momentum by the beginning of October. Last year at thistime we predicted an increase and the actual result exceed our prediction. We would therefore not be too surprised if today’s forecast turned out to be too pessimistic.”

I added the emphasis for a completely non-scientific and totally gut feeling reason: I can’t shake the feeling that we are over-due for a market correction in 2018. I’m not talking about the 2009 version of earth-shattering, life savings-draining market crash.

I’m thinking more along the lines of a 3-5% downturn, which will, for all intents and purposes, make the 2018 market look more like that late 2015 market.

But, if you are thinking that prices will continue to go up, I’m starting to feel that this will not be the same.

I could see that prices will remain strong in the dense, hip, urban areas that are so popular right now. But they may not be immune to the correction.

What do I base this on?

Here are some admittedly non-scientific bits of analysis. To be fair, few people often predict the market accurately repeatedly, so there is no such thing as a truly scientific method when it comes to market behavior.

October 2017 Market Update

Anyway, here is what I’m seeing:

  1. The Cromford Index, which is a good predictor of what the market will be doing 3-6 months from now, seems to be flat or moving slightly downward over the course of the year, as opposed to 2016. This could mean that the market is moving slowly more toward a buyer’s market and away from a seller’s market. Is it a small change and perhaps premature to discuss? Maybe, but I’d rather be ahead of this than behind.
  2. The renovation market, which seems to be over 50% of all homes that are active in CenPho and historic neighborhoods, seems to be pushing prices far up above market averages in areas that were pretty rough just a couple years ago. I don’t see entire neighborhoods changing character over night just because a few renovators made an old home look like the interior of a Anthropology outlet at the mall.
  3. I hear more potential buyers choosing to wait for another year or two because they just can’t believe that prices in some areas will continue to go up. So, yep, its a whiff of a smell in the air, a wil o wisp. But I’ve heard this before. Buyers are tuned in to this frequency, even if subconsciously.
  4. I’m seeing more and more of what I would consider fly-by-night renovation operations that are churning out some pretty terrible products faster than a Double-Double from In and Out Burger.

Its totally a gut feeling on my part. Take it with a grain of salt. But, as a person who owns an investment property, I’m thinking of selling while the market is relatively high. If you bought in 2010 at the lowest point of the market, then this may not be a concern for you. But if you want to cash out, I would start considering a move.

As we often say, the real estate market is not the stock market. Don’t approach it that way. At the same time, you will never know the lowest or highest point. If you buy generally in the trough and sell generally near the peak, it is a good place to be.

If you need help thinking through your specific situation, give us a call at 602-456-9388. 


October 3, 2017by phxAdmin
Blogroll, First Time Home Buyer, Live, Market Analysis

September 2017 Market Update

For the September 2017 Market Update, we check in again with Tina at the Cromford Report.

“Supply remains lower than last year, but the gap closed slightly compared with last month in terms of active listings with no contract. We are starting to see more new listings than last year. The third quarter is up 2.5% from last year and up 5.5% from 2015. So far the extra supply is not having much effect, but if it continues for several months finding a property could start to get a little easier for buyers.

The monthly sales rate is up only 1.8% compared with a year ago. Both August 2016 and August 2017 had the same number of working days (23) so we have a fair comparison to draw. Since the year over year growth was 5.7% in June and 3.0% in July we again see a continuing slow downward trend in the advantage that 2017 has over 2016 in sales volume. Growth in the annual sales rate has almost stopped with 95,000 proving to be a difficult line of resistance. All these point to a gradual fading of demand. The serious shortage of supply obscures that fade.

We experienced a seasonal price drop between June and July, but prices have already bounced back during August and are likely to remain on an upward track for the rest of 2017 at least.

We still have a seller’s market in most locations and price ranges, but the current trends means the seller’s advantage has very little momentum. Before buyer`s get too excited, the trends are very mild in nature. As such we do not currently see major increases in buyer’s bargaining power coming anytime soon.

Of course, the market could change quickly, as it did in the summer of 2013, but there is not much sign of this in any of the numbers at the moment.”

Sept 2017 Market Update
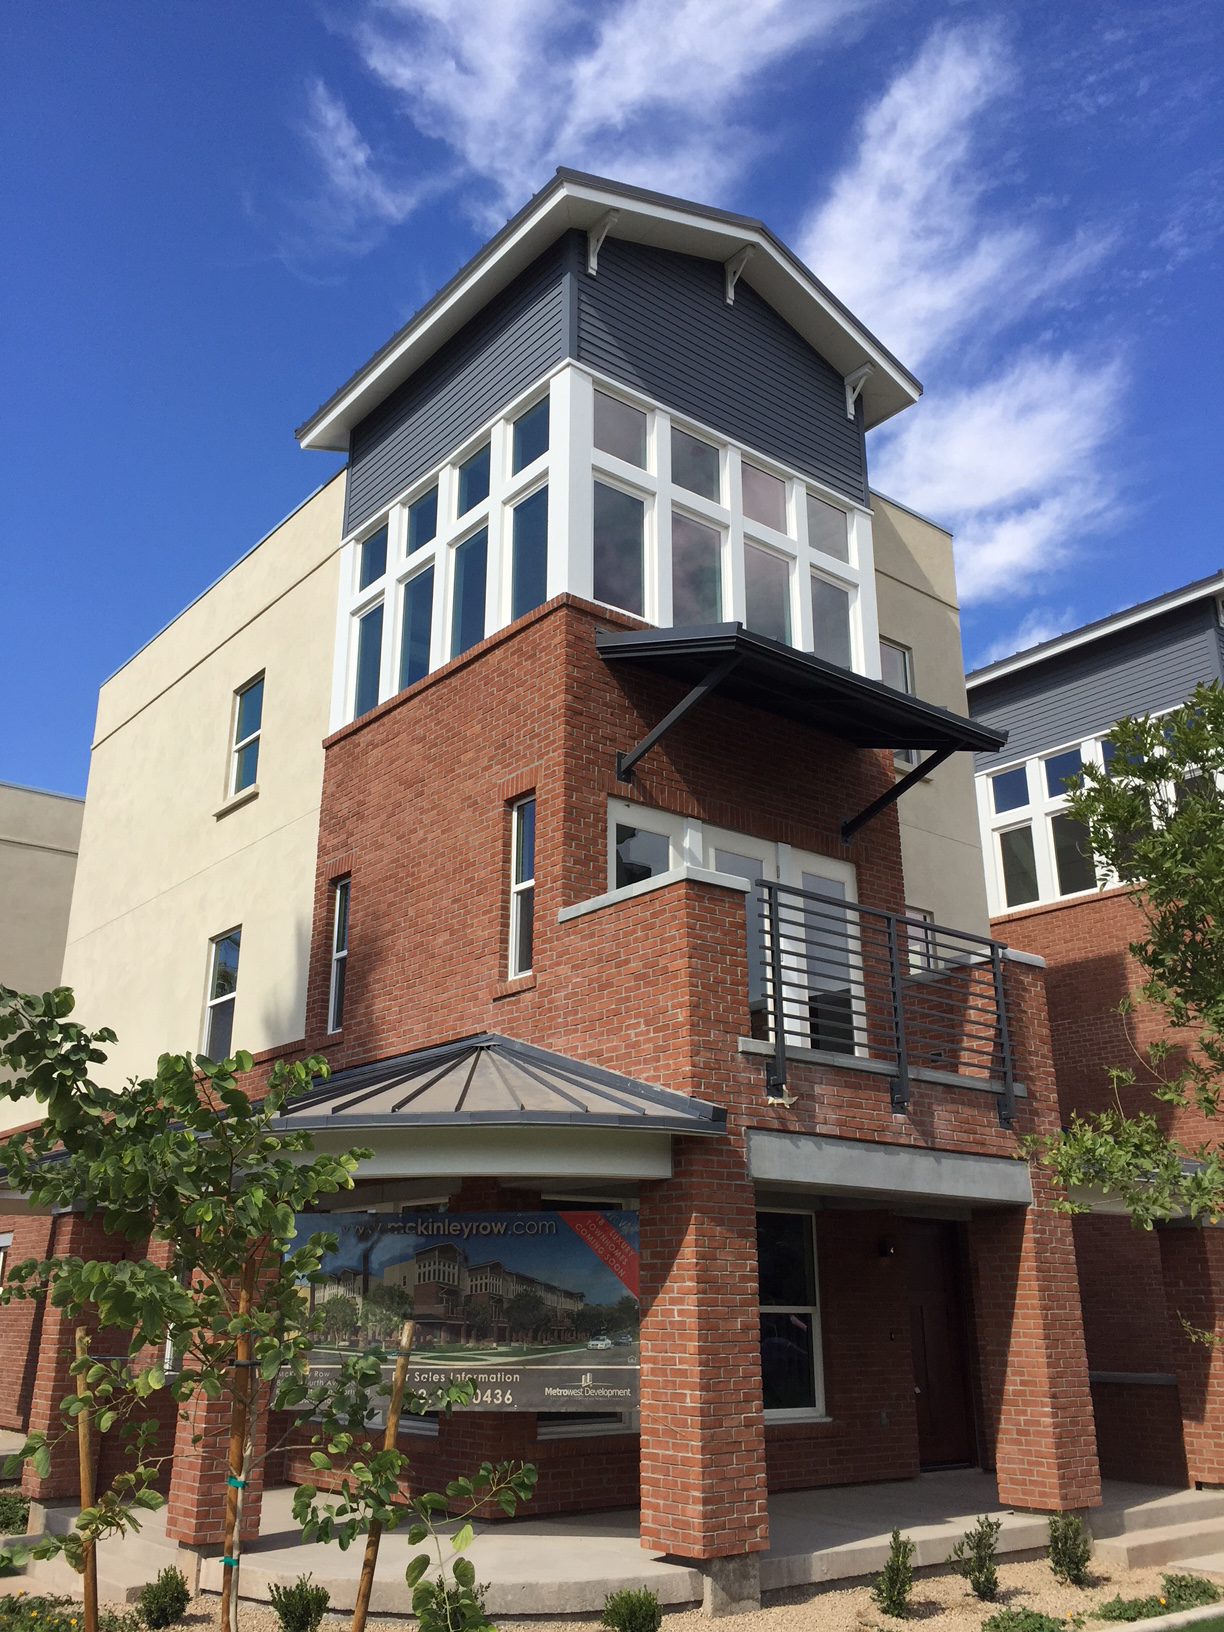
Anecdotally, we are seeing a huge number of renovation project that seem to dominate the market. I would go so far as to say that they are probably driving prices upward, as the investors are seeking high profit margins and buyers are willing to pay, given a lack of options in CenPho.

In a way some renovations are sad for the historic neighborhoods. I’ve heard many concerns from neighbors that the renovators are taking this historic souls right out of the homes –turning them in to trendy replications of an Anthropology clothing store.

If you are thinking of purchasing a renovated property, please be certain to have a realtor represent you, even if its not us. Many people don’t know that renovators are still responsible for disclosing the condition of the property, even if they claim they never lived in it. You need an agent to protect your interests.

Call us and we can give you more details at 602-456-9388.


September 6, 2017by phxAdmin
Blogroll, First Time Home Buyer, Live, Market Analysis

What do Renters Need to Earn?

I saw this article in AZCentral which asked what renters need to earn in Phoenix in order to live here.

Y’all know that I’ve been critical of the number of apartment units that have been going up in Central Phoenix, as well as the fact that they are priced way above what is affordable here.

But, here’s the next question: What do these same renters need to earn in order to purchase?

Of course you would expect a realtor to ask that. We all just want to get everybody to buy a home, right?

Wrong.

I don’t actually believe that everybody need to purchase a home. However, the last I checked (about two years ago) there was a 6-to-1 ratio of apartments being planned downtown to owner occupied homes being considered. Those apartments have since been built.

While home ownership is not for everyone, I do think those numbers are way off.

But, I digress.

This article addressed what millennials need to save in order to purchase a home. The article is terribly misleading because it assumes that they need to save 20% of the median home price (about $27,000) to buy. So, it predicts that it will take them 13 years to save that.

Near the end of the article, they admitted that people can still get FHA and Conventional loans for 5% down, and under. But, very, very few people actually purchase with 20% down. So, why start the article on such a misleading point?

Oops. I digressed again.

The reason I asked what that same apartment renter needs to purchase a home is because I know that apartment companies are charging much more than what these folks would pay to own a home, if only they had good credit and down payment.

In other words, renters pay a premium for living space (more than owners) when they don’t have good credit and funds to purchase a home.

So, the question to be answered is what is the real minimum income that a person would need to make in order to purchase a home in Phoenix?

The answer, of course, depends on where in Phoenix they purchase and how much they have to put down.

Let’s assume they are making just enough to afford the county-wide median home, at $245,000. Let’s assume they bring the minimum down payment for FHA at 3.5% and that they have just enough to cover closing costs. Let’s also assume about $8,600 for down payment an another $4,500 for closing costs.

That $245,000 home (assuming no HOA fees) will cost you about $1,500 per month, depending on property taxes. I think that many, if not all of the apartments downtown cost more than per month that AND are probably smaller.

Just a disclaimer: I’m not a lender. So, this is just an illustration. If you are thinking of buying a home, I can share some leads for you of great lenders.

So, what is a minimum of that renter needs to earn in order to purchase? According to my calculations, about $40,000. Again, I could be off, so talk to a lender. But, my point is that home ownership is much more attainable than many think –and that’s where the apartment builders get you!

If you are thinking about purchasing a home, please call us first at 602-456-9388.


July 6, 2017by phxAdmin
Blogroll, First Time Home Buyer, Live, Market Analysis

July 2017 Market Update

As we do each month, we check in with the Cromford Report for their monthly update. Here’s your July 2017 Market Update.

July 2017 Market UpdateFor the monthly period ending June 15, we are currently recording a sales $/SF of $151.10 averaged for all areas and types across the ARMLS database. This is up 0.4% from the $150.45 we now measure for May 15. Our forecast range midpoint was $151.94, with a 90% confidence range of $148.90 to $154.98. We were correct in forecasting a rise, but the actual rise was only about half as big as forecast.

On June 15 the pending listings for all areas & types shows an average list $/SF of $154.91, up 0.6% from the reading for May 15.

Supply has been falling quite sharply in the last few weeks while demand is little changed. However, we will shortly be entering the third quarter, a period famous for weaker pricing. This is because the luxury market loses a lot of sales volume during the hottest months, whereas the rest of the market slows to a lesser extent. This is a seasonal effect and does not indicate underlying weakness. We would expect the upward price trend to resume once we get to the end of September.

Now back to you, Ken.

Thanks, Tina.

July 2017 Market UpdateSo, here’s our more anecdotal view of the July 2017 Market Update for Central Phoenix and the historic neighborhoods. We are seeing property prices continue to move up in CenPho at a faster clip than the county-wide numbers. The chart here is for all prices. When I looked at different price brackets, the move remained.

In short, people want to live in CenPho. But you knew that, didn’t you?

We don’t believe that this means sellers can price absurdly high and expect to get what they want. Two of our recent listings downtown did have small price drops off of the original list price. That’s normal.

July 2017 Market UpdateThe Cromford Index continues to indicate a strong seller’s market, stronger than the last two years. This is, in large part, due to the shortage of available homes. You’ve heard me recently complain about the over-built rental market. Some of those projects could have been condos. This is the result.

As we often say, your decision to buy or sell should be about need rather than a desire to play the market. We can help you make the best decision with market-based data and experience.

Call me (Ken) at 602-456-9388 and let’s chat.

June 30, 2017by phxAdmin
Page 4 of 25« First...«3456»1020...Last »

Subscribe to Our Newsletter

We keep your data private and share your data only with third parties that make this service possible. Read our Privacy Policy.

Thank you! Please check your inbox or spam folder to confirm your subscription.

Categories

  • Art
  • Blogroll
  • Design
  • Editor's choice
  • Events General
  • Events GYP
  • Fashion
  • Featured
  • First Time Home Buyer
  • Homes
  • Life
  • Light Rail
  • Live
  • Market Analysis
  • NeighborhoodVideos
  • Phoenix News
  • Photography
  • Photoshootings
  • Profiles
  • Public Policy
  • Renovation
  • Renting
  • Restaurant Reviews
  • Sustainable Living
  • Tips
  • Uncategorized


© 2015 copyright GET YOUR PHX ® // All rights reserved // Privacy Policy