Get Your PHX - A Whole New Way to Experience Phoenix
  • Home
  • Our Blog
  • About Us
  • Contact
Get Your PHX - A Whole New Way to Experience Phoenix
Home
Our Blog
About Us
Contact
  • Home
  • Our Blog
  • About Us
  • Contact
Blogroll, Live, Market Analysis

February 2019 Market Update

The following is a market update, directly from our friends at the Cromford Report. I’ve been reporting that the seller’s advantage is slipping. Plus, Michelle and I have been seeing anecdotal evidence backs up what you can see below.

While Cromford has some optimism for late February, we suggest that you take an aggressive pricing stance if you are listing your property.


The Cromford Market Index continues to weaken for sellers and we expect a little more negative movement over the next 2 weeks for 2 reasons.

  1. Slow contract activity during the first 2 weeks of January led to a larger rise in active listings than last year
  2. Low contract numbers in November and January led to a very slow closing rate during January

However, we are more optimistic for sellers than we were in mid January. The second half of January saw contract activity pick up nicely and this has 2 expected results which could show up in the index by mid February:

  1. Active listing counts should stop rising and may start to fall back slowly in a normal seasonal pattern  (see chart)
  2. Closed listing counts should start to rise as the additional contract signings in January come through escrow

It is not clear if the boost in contract activity will continue into February but a combination of lower interest rates and higher FHA loan limits tends to support that outcome. 


If you want to build the right strategy for buying or selling, call us at 602-456-9388. We can help.

February 5, 2019by phxAdmin
Blogroll, Live, Market Analysis

Contract Ratio is Down

What is the contract ratio?

According to the Cromford Report, it’s down.

That means that the homes that are sold, as a percentage of the total number that are active, has gone down. Fewer houses are selling every month, once on the market.

The specific definition from the Cormford folks: The contract ratio “specifically measures the number of completed sales contracts relative to the supply of active listings. The higher the number the greater the buying activity relative to supply. If this number rises then it is a sign of growing contract activity and a positive signal for sellers. Conversely a falling number is a sign of a weakening market – either supply of active listings is increasing or contract activity is slowing, or both. In a balanced market for normal market segments, the value of the Contract Ratio is usually between 30 and 60. When it lies below 20 the market can be considered “slow” or a “cold market”. Above 60 can be considered a “hot market” and when it moves above 100 we regard this as evidence of a “buying frenzy”.

This chart shows that the contract ratio in January of 2018 was 47% and it is now at 37%. That’s not a small amount. It rose from 2017 to 2018 by 7%, and 3% between 2016 and 2017.

We’ve been predicting a change in the market for about a year, and I think you are about to see it happen.

The Cromford folks are not calling it yet, but they did note that December was particularly slow:

“December was unusual in many ways. The most obvious was the low number of listings going under contract. We can see this from the 18.5% drop in listings under contract compared with the start of the month. Closings were strong for the first 2 weeks of December, slightly higher than in December 2017, but then slumped badly in the second half, ending the month almost 10% down on December 2017. December contained 20 working days in both 2017 and 2018 so we do not need to adjust for the calendar. In every respect, December was a weak month for demand, the weakest December we have seen since 2014 for sales (6,422 in Dec 2014). We have not seen listings under contract this low on January 1 since 2008. Clearly buyers are unenthusiastic about buying homes compared with just a few months ago.”

So, what should you do if you are thinking of listing? Price aggressively!

If you are thinking of buying, now is when you may have a little more leverage. You won’t be able to come in with an offer 10% under list price, but you might be able to negotiate some other concessions.

Call us at 602-456-9388 and we can help you build the right strategy.

January 14, 2019by phxAdmin
Blogroll, Live, Market Analysis

January 2019 Market Update

Well, we go in to 2019 for our January Market Update with a little uncertainty about the market. Anecdotally, agents that I’ve spoken with have not seen the numbers of buyers coming to their doors that they would have liked. I have opined in the past that this may be a result of jitters over the election and the stock market.

But, January is a new month in a new year. So, we are all watching what happens. Thus, we check in with our friends at the Cromford Report:

“December was unusual in many ways. The most obvious was the low number of listings going under contract. We can see this from the 18.5% drop in listings under contract compared with the start of the month. Closings were strong for the first 2 weeks of December, slightly higher than in December 2017, but then slumped badly in the second half, ending the month almost 10% down on December 2017. December contained 20 working days in both 2017 and 2018 so we do not need to adjust for the calendar. In every respect, December was a weak month for demand, the weakest December we have seen since 2014 for sales (6,422 in Dec 2014). We have not seen listings under contract this low on January 1 since 2008. Clearly buyers are unenthusiastic about buying homes compared with just a few months ago.

Sellers are not showing much enthusiasm either, coming up with fewer new listings than last year. However the number of active listings is on an upward trend due to fewer of them going under contract than usual.

We have the Cromford® Supply Index at 66.3 at the start of 2019 telling us that we are missing about a third of the supply of active listings we would normally expect in a balanced market. The Cromford® Demand Index stands at 87.7, the lowest level since 2014 and implying we have about 12% less demand than we would expect in a balanced market. The combination of very low supply and low demand gives us a Cromford® Market Index of 132.3 with sellers having the edge. However the Contract Ratio of only 36.3 (45.4 last year at this time) tells us that we have a cooler market than usual.

Prices are still moving upwards but the annual appreciation rate has stopped rising and is now heading downward. It remains well above the general inflation rate, however. The monthly average price per sq. ft. is up 5.3% from a year ago while monthly median sales price is up 5.9%.

The market will be watching closely to see how many new contracts are signed in January. This will give us a reasonable idea of whether buyer enthusiasm is still waning or is starting to recover. Market distress is extremely low and most home owners have plenty of equity. The only real problem is a shortage of committed home buyers.”

So, what does this mean for you? Well, if you are a buyer, don’t wait for many months to buy, only to find out that higher interest rates have eaten away your buying power. If you are thinking of selling, let’s talk strategy.

Give us a call at 602-456-9388. Depending on when you purchased, you might want to wait, or you might want to get right in to the market.

January 3, 2019by phxAdmin
Blogroll, Live, Market Analysis

Does it Pay to Wait to Buy?

interest

The Cromford Index shows who has the advantage and by how much. Seller advantage has been slipping since May.

We are fairly certain that the seller’s advantage in the market is slipping right now.

See this blog post from last month about the seller’s market and the Cromford Index for more information about.

It does not necessarily mean that houses will drop in price drastically. Frankly, we won’t know how permanent this change is until the end of January. It is very possible that buyers are staying away because they were watching the elections, the dropping stock market and the President’s trade wars.

However, because there is still a shortage of homes in CenPho, I don’t think any price drop will be too drastic –certainly not as much as it could be in the suburbs.

I’ve predicted a drop of between 5% and 7% over 2019, if the market drops at all.

However, if you are waiting to purchase because you’ve been hearing rumors of an over-heated market, you might want to consider this important point: you may lose any savings from a lower market when interest rates go up. See this article that I wrote a couple years ago on the issue.

And to be sure, the Federal Reserve is making strong noises that it will raise interest rates throughout 2019.

In short, if you purchase a $300,000 home today at 4.5% interest and 5% down, your P&I will be about $1,444, depending on the lender. If that home were listed at 5% less next summer ($285,000) but interest rates go up to 5.5% with 5% down, your P&I will be about $1,537! 

So, if you are waiting, you could end up paying more. If you get in now and make an aggressive offer while sellers are feeling the slow market you could save money and avoid the higher interest rates.

I happen to know a couple realtors who are really good at negotiating offers, by the way. Call us at 602-456-9388. 


December 4, 2018by phxAdmin
Blogroll, First Time Home Buyer, Live, Market Analysis

Time to Sell?

sell
Is it time to sell? Well, we’ve been seeing some indicators that the market might shift soon –probably not a lot since there is still a shortage of houses, especially in CenPho.
So, I decided to look at the market data from The Cromford Report to see if what Michelle and I are seeing anecdotally is manifesting everywhere.
Here are a couple points that indicate that a market shift could be on its way (but not a huge one from what we can see now).
1) The price per square foot has taken a small drop of $6/sqft since July. Not big. But, when you combine it with the next point, it may indicate a change.
2) The Cromford Index is a measure of whether it is a seller’s market and, if so, by how much. Anything over 100 is a seller’s market. The seller’s advantage has been dropping since May. Most of this is normal for the summer. But notice that it has been more pronounced since late September. This index is made up of data from closings —such as sellwhether the sellers had to offer concessions, etc.
Just to put that in perspective, we are still over 140, so that is a strong seller’s market. This just tells me that sellers should be prepared to price aggressively if they want to sell quickly.
What does this mean for you? If you are thinking about selling, we suggest you price conservatively and prepare yourself to drop incrementally every couple weeks if you are not getting the buyers in the door.
What does this mean if you are a buyer? Well, it could mean that you may be in a position to be mo re aggressive in your offers.
Call us at 602-456-9388 if you need help making your next move.
October 27, 2018by phxAdmin
Blogroll, Live, Market Analysis

Early September 2018 Market Update

Market Update The Early September Market Update from the Cromford Report shows a continued shortage in the market, especially in homes under $250,000, as compared to last year.

Starting with the basic ARMLS numbers for September 1, 2018 and comparing them with September 1, 2017 for all areas & types:

  • Active Listings (excluding UCB): 16,222 versus 17,486 last year – down 7.2% – but up 3.4% from 15,686 last month
  • Active Listings (including UCB): 19,831 versus 21,355 last year – down 7.1% – but up 2.1% compared with 19,415 last month
  • Under Contract Listings (including Pending, CCBS & UCB): 8,871 versus 9,871 last year – down 10.1% – and down 5.5% from 9,384 last month
  • Monthly Sales: 8,230 versus 8,252 last year – down 0.3% – and down 3.7% from 8,548 last month
  • Monthly Average Sales Price per Sq. Ft.: $161.10 versus $149.47 last year – up 7.8% – and up 0.2% from $160.76 last month
  • Monthly Median Sales Price: $262,000 versus $245,000 last year – up 6.5% – but down 1.1% from $265,000 last month

Market UpdateThe supply of active listings without a contract rose 3.4% during the month of August, while total active listings increased by 2.1%. These are bigger increases than we saw in August 2017 so there has been a slight improvement in supply even though it remains very low by normal standards.

The count of under contract listings continues to weaken relative to the last 3 years and indicates a gradual reduction in demand. Demand at the low-end of the market cannot be satisfied as the number of available homes below $250,000 is far too low. With supply moving up a little and demand down a little, it is not a surprise to see the Cromford® Market Index lower than last month. It still remains at a significantly elevated level relative to normal, however, and so we are in a strong seller’s market.

Pricing is behaving normally for a seller’s market with 3Q average and median prices lower than 2Q. We still expect 4Q to hit the high point for the year as any weakness in demand is compensated for by long-term shortages in supply.

If you are looking for more analysis of the market, please call us at 602-456-9388.

September 17, 2018by phxAdmin
Blogroll, First Time Home Buyer, Live, Market Analysis

2018 Listing Activity

The 2018 listing activity (aka supply) has been consistently lower than that of 2017.

Seems odd, doesn’t it? I mean, doesn’t it seem like you see another flipper home every time you look around a street corner?

Ask the folks in the greater Coronado neighborhood and they’ll tell you that, I think. Of course, they have other concerns, as older homes are being gutted and doubled in size so that they often look very little like their original historic predecessors –despite the hopes to protect historic homes.

supplyBut, I digress…

Back to the listings.  Have a look at the 2018 supply compared to the 2017 supply for Phoenix. Supply has lagged anywhere from 5% (now) to 12% (March).

Why? What’s up with that? What does that mean for you?

First, the “why.” When I’ve spoken to our friends at the Cromford Report, they’ve confirmed to me the same factors we’ve seen brewing for a while: there is an insufficient amount of new construction and labor is tight. So, if developers can’t build or flip quickly due to a labor shortage, we won’t see new listings coming on the market.

What I find particularly interesting is how this breaks down by area.

supplySee this chart. This shows the difference in supply between 2017 and 2018 by major valley areas.

What accounts for this difference? According to Tina at the Cromford Report, South Phoenix has gone gangbusters since week 23 in the median sales price zone. She believes this is one of the only areas where they are building affordable housing in gated communities.

Second, the “what does that mean for you?” If you are selling, this is great for you. Of course, over-price your home in a fit of irrational exuberance, but don’t leave money on the table. We can help with pricing your listing right.

However, if you are buying, it means you are up against an excess of demand. Too many buyers for the supply. Be prepared to compete.

We need to analyze two things if you are thinking of getting in the market: location and availability. Are you looking in an area where a lot of building and flipping is going on? Are you looking in areas that are in need to new inventory?

Call us at 602-456-9388 and we can build a plan together.

September 10, 2018by phxAdmin
Blogroll, Live, Market Analysis

July 2018 Market Update

This month’s Market Update is about the larger direction in the Phoenix real estate market.

Before I get in to that, let’s look at what the staff at the Cromford Report has to say about the market:

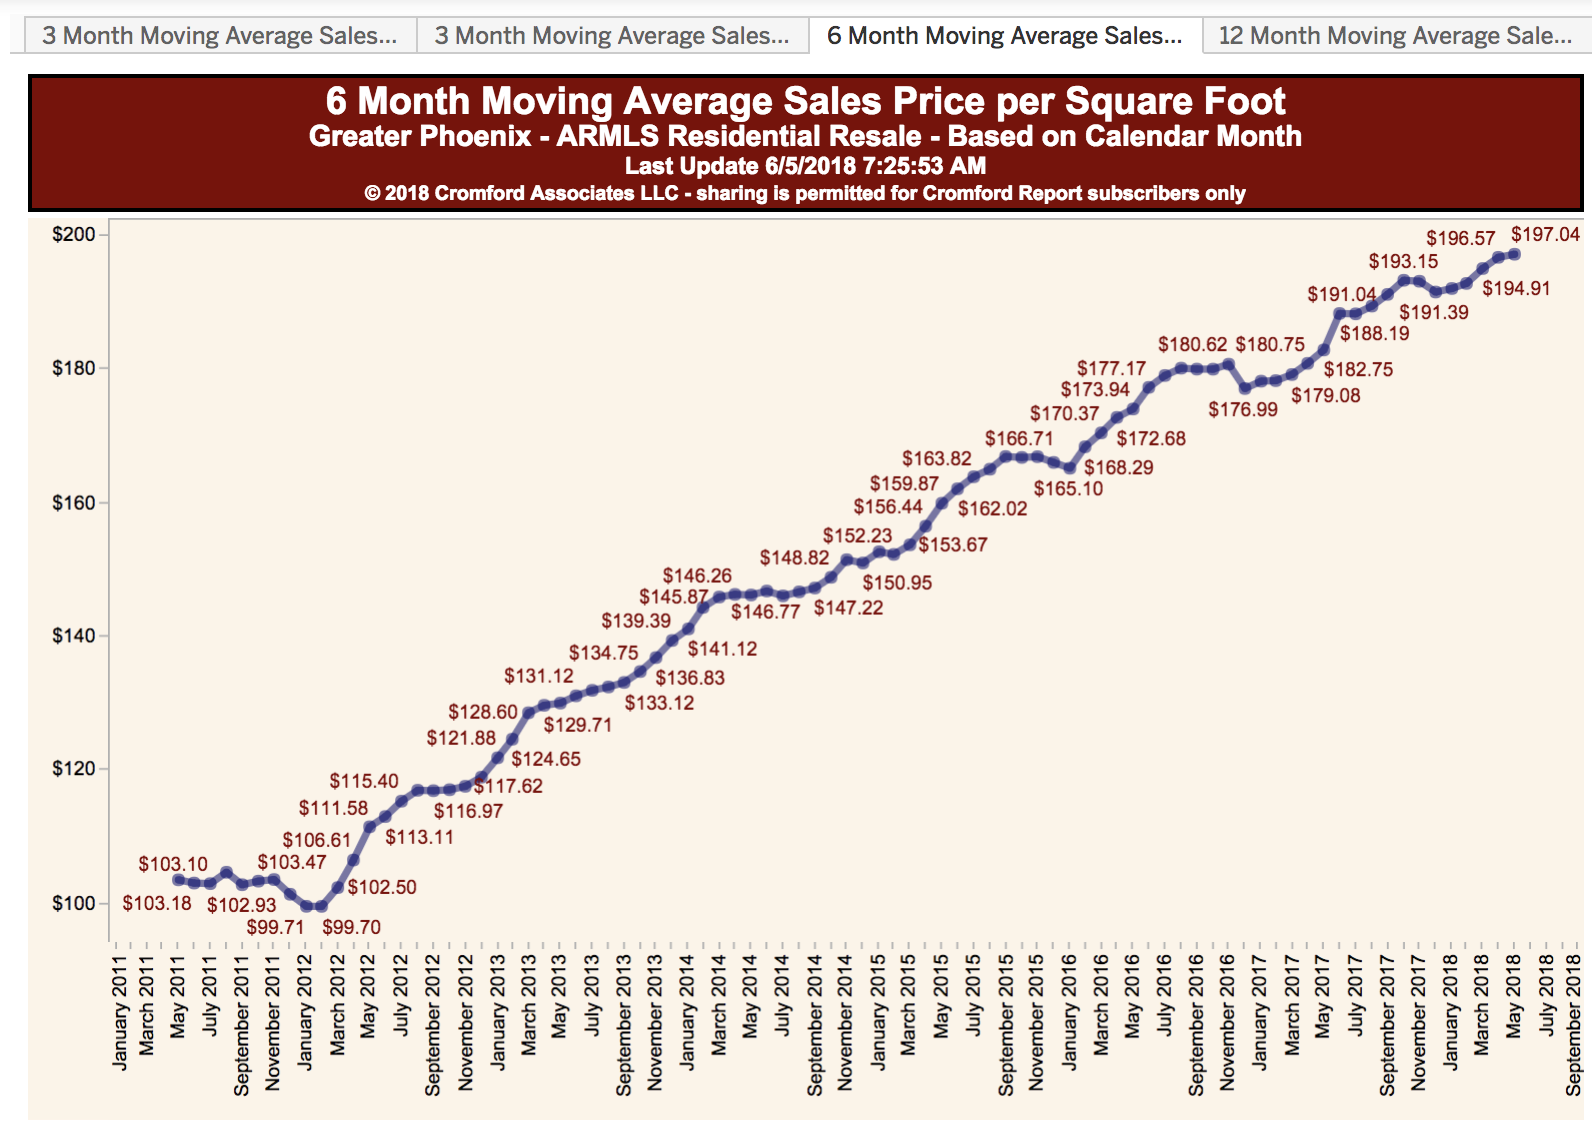
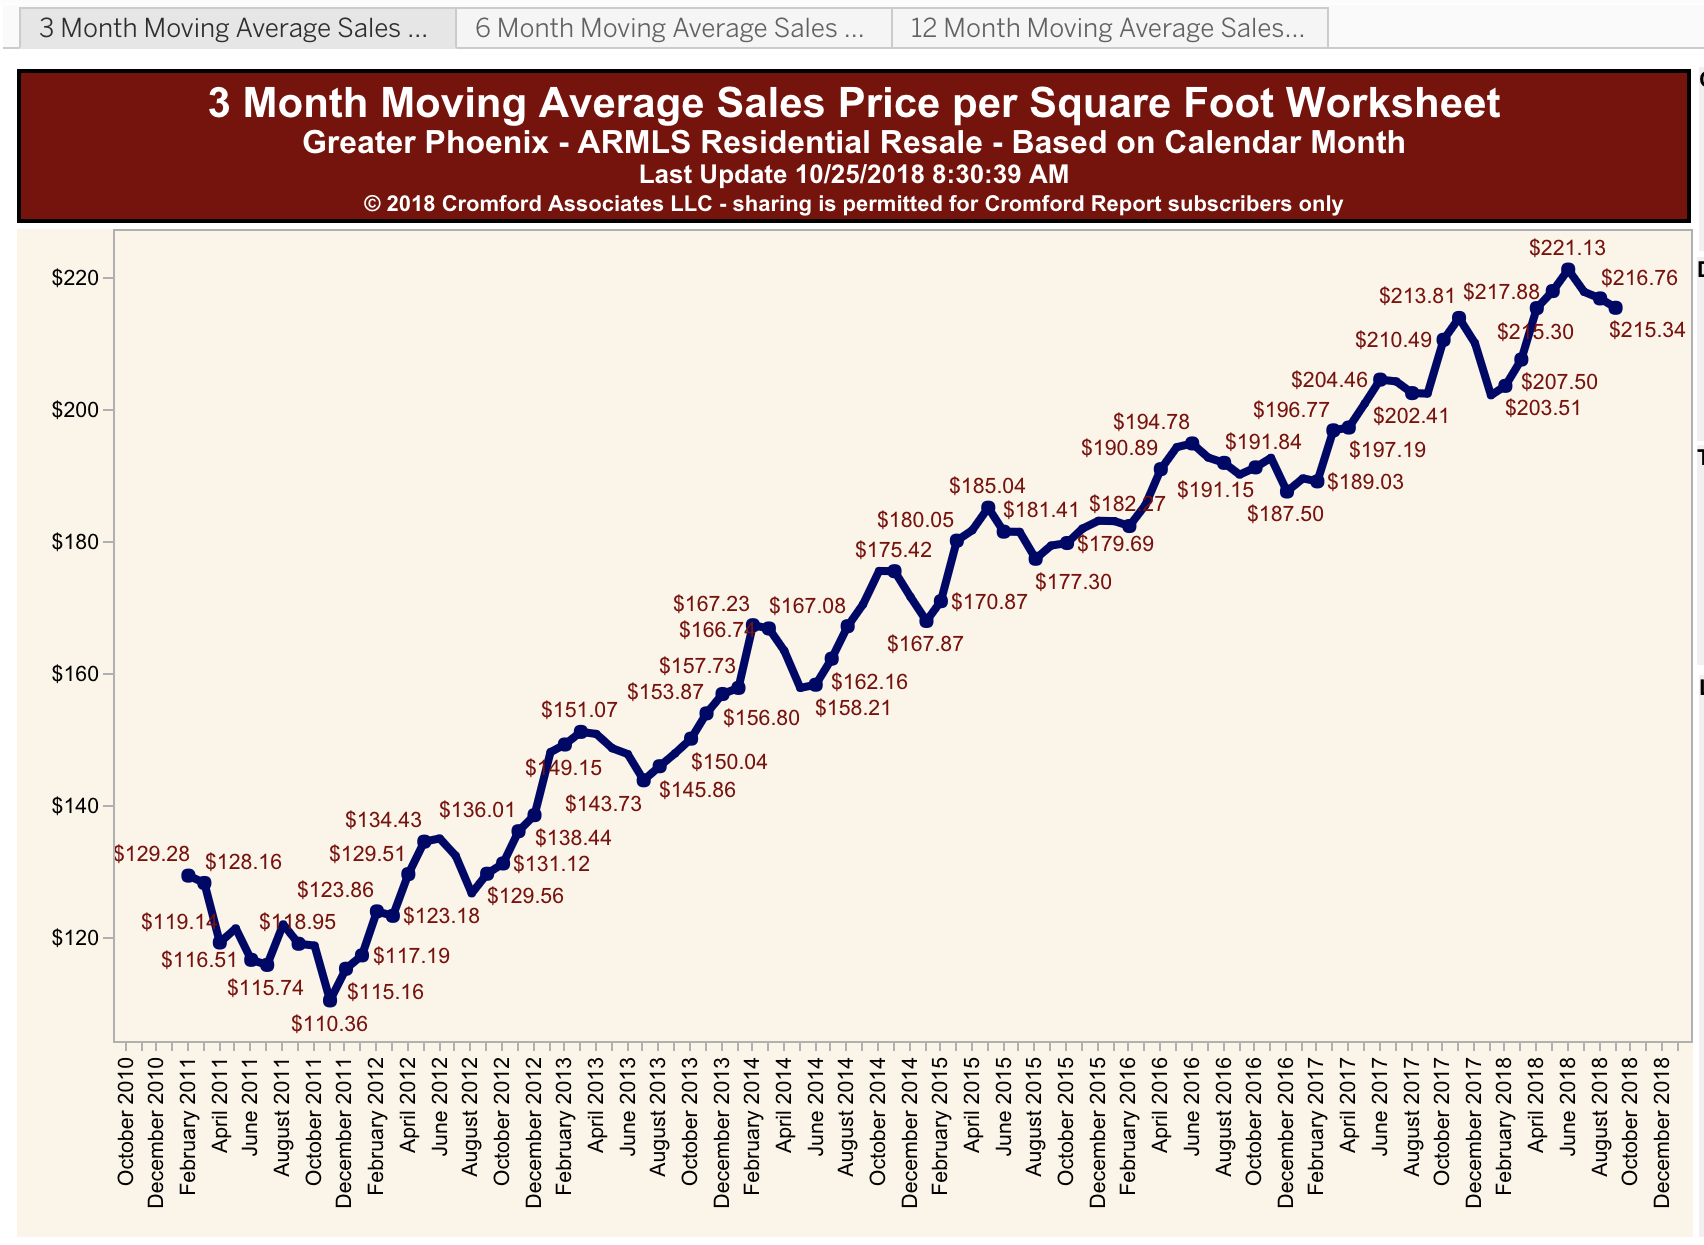
“For the monthly period ending June 15, we are currently recording a sales $/SF of $164.10 averaged for all areas and types across the ARMLS database. This is up 1.0% or $1.64 cents from the $162.44 we now measure for May 15.

Our mid-point forecast for the average monthly sales $/SF on July 15 is $163.80, which is 0.2% below the June 15 reading. We have a 90% confidence that it will fall within ± 2% of this mid point, i.e. in the range $160.52 to $167.08.

We are now faced with the third quarter which is almost always a weak period for average price per sq. ft. A forecast decline of 0.2% between now and July 15 would be less than average and has no real significance over the longer term.”

market update

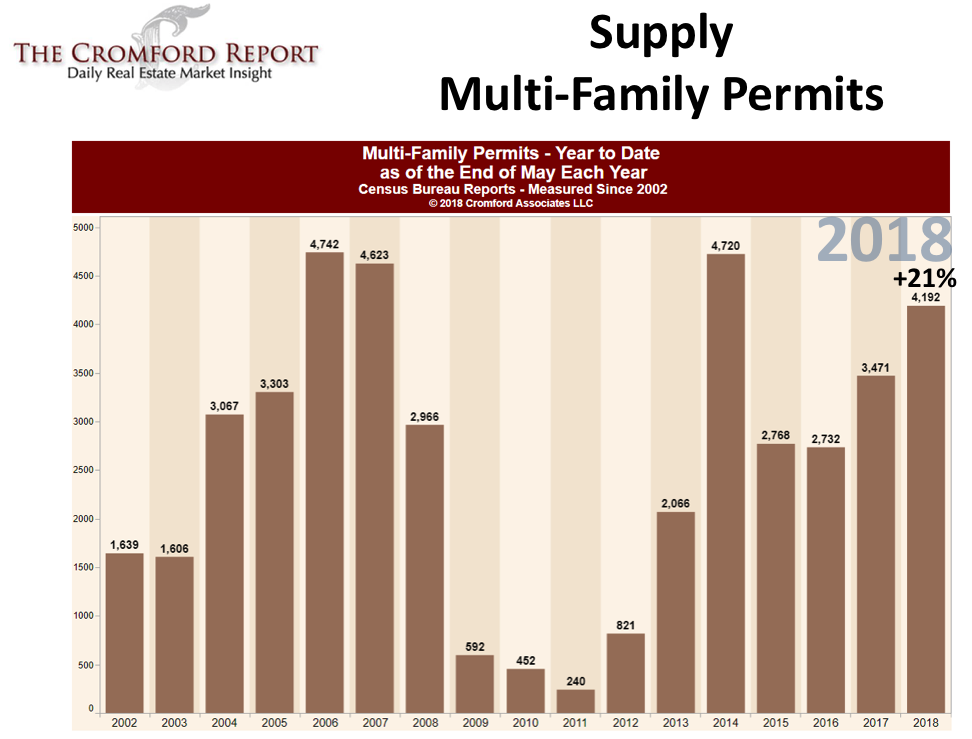
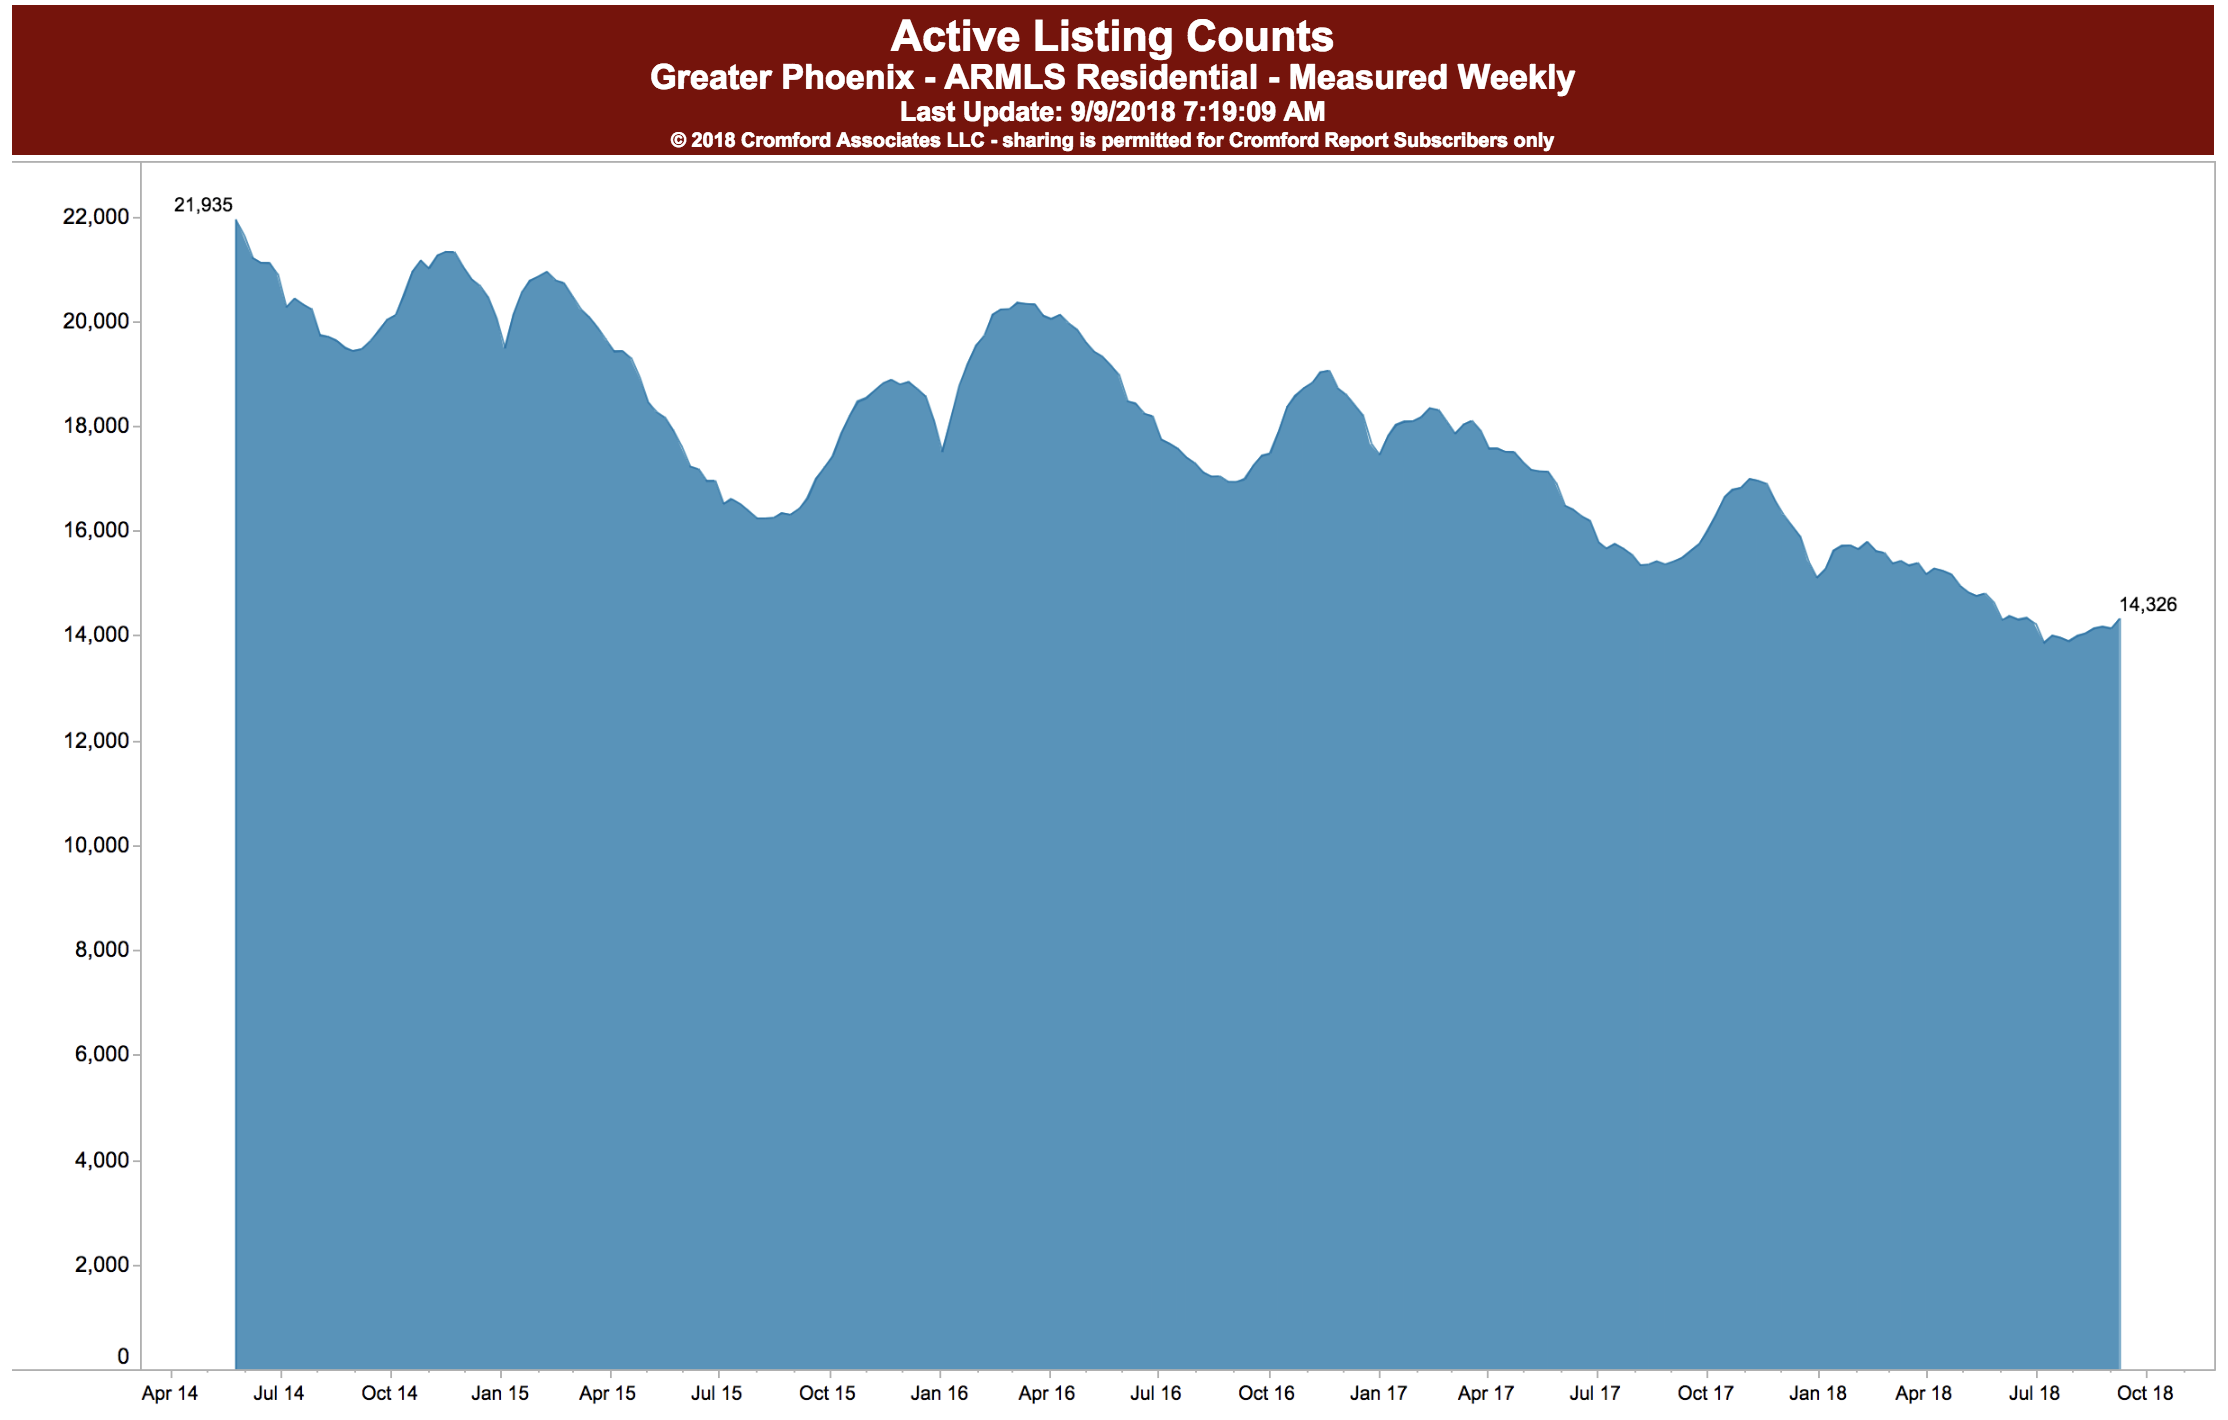
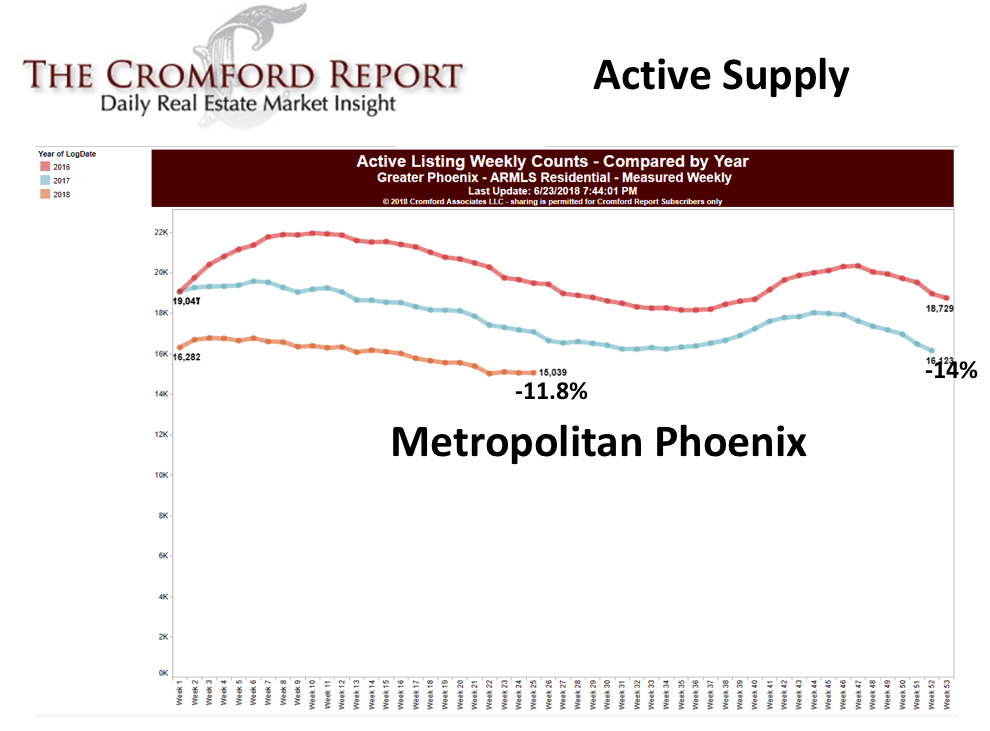
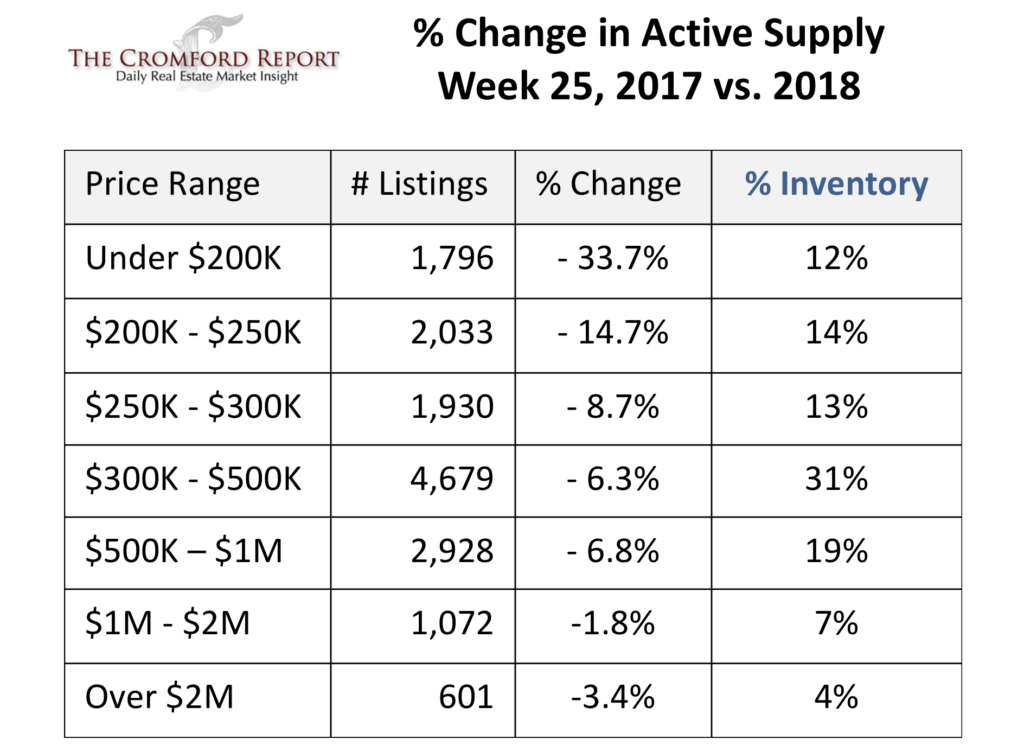
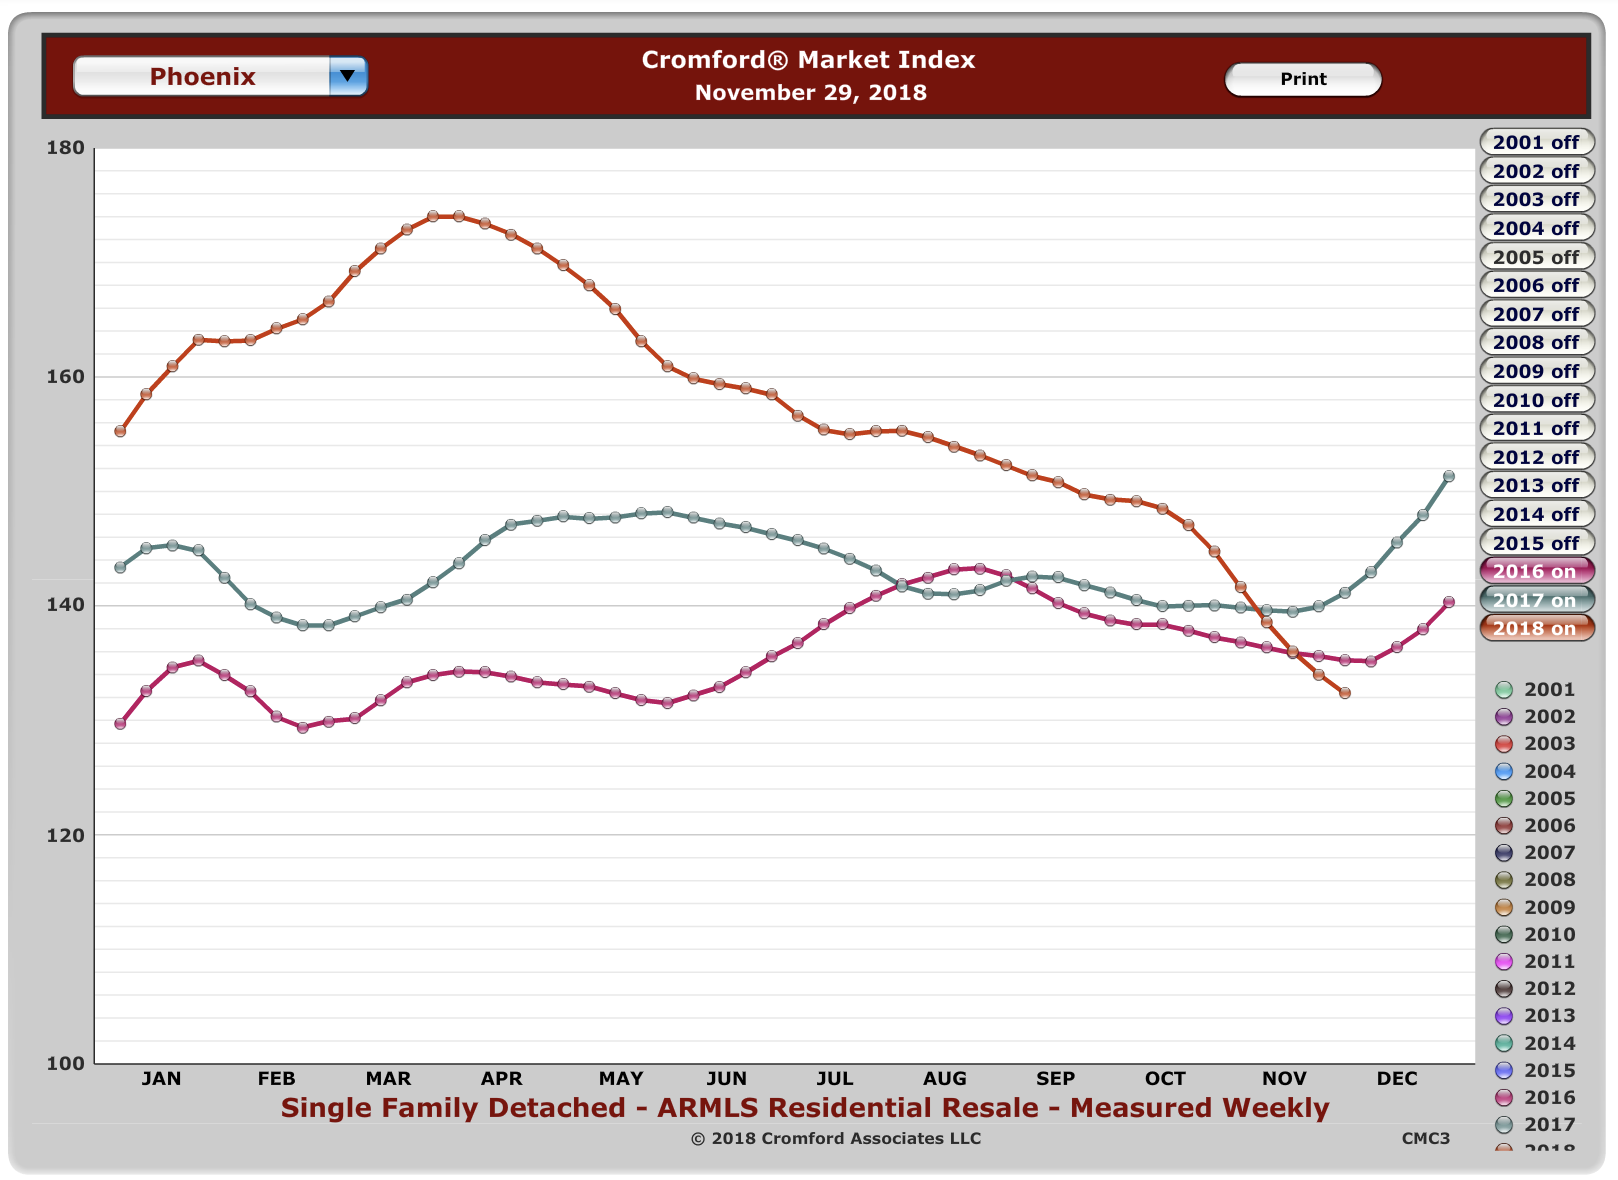
From Cromford Report presentations and our experience in the field, Michelle and I are seeing that we are still dealing with a shortage of supply and an increased demand –despite the fact that permits for multi-family and detached residential have been up since last year.

The new construction of multi-family has been small in CenPho and downtown by comparison to the rest of the valley. Indeed, those condo projects that have happened in CenPho and downtown are largely completed now and sold off. So, what is coming next amid this sea of apartments?

To put this another way, the increasing prices have more to do with supply and demand than they do with loose financing, as we saw prior to the “recession who’s name shall not be spoken.” See below. Yet, the increased number of permits is not keeping up.

At the same time, the number of flipped houses it an all-time high, despite the fact that profits on flips don’t seem to be as high as you might think they would be. Conversations with Cromford indicate that flipped homes will continue to be a dominant force in the market. We want to make certain that the work has been done properly on any flip that our clients consider, and that the flippers complete a full disclosure.

Here are some projections from Cromford:

•Despite reports of Phoenix being overvalued, prices are projected to continue to rise over the next 3-6 months. (We are still in a reasonable range of affordability, but lesser so downtown).

•Luxury homes are expected to continue to be positive due to tax reform changes, exchange rates and stock performance. (Tariffs?)

•Tariffs on lumber and other building materials will have an affect on new home prices, flip costs and remodeling.

•If prices surpass where the Valley should be historically along the 3% annual growth line, then appreciation will probably slow down. This could NOT FEASIBLY happen until early 2019.

So, what does this mean for you if you are buying a home?

It means that you need an experience set of eyes on any home that you purchase, especially a flipper.

Sellers need to still price aggressively, especially going in to the summer. We continue to run in to sellers who (despite our warnings pay too much attention to Zillow, Realtor.com and Trulia), want to list too high. In 90% of the cases, they will learn where the market actually is only after a few months of dropping their prices.

You want to remember that you are up against fully-remodeled homes that feel completely new to buyers.

You can feel free to use the data that we provide. Ask us questions and we will confer with the experts at the Cromford Index, if we don’t know the answer.

We have access to the best data in the state and we are ready to share that knowledge with you.

Contact us at 602-456-9388 if you are thinking of buying or selling.

June 29, 2018by phxAdmin
Blogroll, First Time Home Buyer, Live, Market Analysis

June 2018 Market Update

In this month’s market update, it certainly feels like some changes are coming, but it may be too soon to tell what they will be.

Our friends at the Cromford Report are seeing some tightening in supply, and thus increased prices.

“We can see that the supply of active listings without a contract dropped again during the month of May but the deficit compared with 2017 narrowed slightly to 13.3%. May was a weaker month for new listings, down about 1% compared to last year. This was a contrast to April which had seen a stronger rate than 2017. We normally see total supply drop between May and June and we still expect this downward trend to continue until September.

The sales count for May was very strong, topping 10,000 for the first time since 2011. However the number of listings under contract at the beginning of June is much lower than last year – down 6%. Even with this possible sign of wavering demand, supply is so weak that sellers still have a huge advantage in negotiations. This situation inevitably leads to price increases and the annual rate of change has reached 9% for average $/SF and 9.5% for median sales price. This growth is about 4 times the inflation rate and with interest rates rising, homes are obviously getting less affordable. At some point this trend will impact demand, which is why we are keeping a close watch on the annual sales rate and the number of listings under contract.

The rise in interest rates does not just tend to lower demand, in the current circumstances it can lower supply too. Home owners with an existing mortgage will be less inclined to move if their next mortgage is going to be at a much higher rate than their existing one. This is more likely to be the case with every passing month. As a result we do not see prices as likely to fall because of interest rate rises, but we do anticipate limited growth in sales volumes.

It is important to compare sales numbers year over year, but we should also point out that the presence of iBuyers means that there are more transactions than there would be without them. In situations where a seller accepts an iBuyer offer, the home is resold again in a matter of months, so we see 2 transactions instead of 1. The first sale is not shown within the MLS numbers but the second almost always is. Both sales appear in the counts when we look at recorded deeds. With iBuyers representing 4% of the re-sale market, counts of recorded sales are about 2% higher than they otherwise would be.

We started referring to the chronic low inventory over 5 years ago and it is now at the lowest level we have seen during those 5 years. Fluctuations in demand are unlikely to have much impact on the market until we see an increasing trend in listing counts. This was the first sign of a slowdown in April 2005 and will be the first sign of a slowdown if and when we get one in the future. It came suddenly and unexpectedly in April 2005 and it may do the same at any time. However, nobody paid any attention in 2005 and I am assuming we are all older and wiser now. Any unusual activity in the listing counts will show up in the daily Tableau charts which we create and study each and every day.”

June 5, 2018by phxAdmin
Blogroll, Live, Market Analysis

May 2018 Market Update

This month’s market update shows a transition in to the spring/summer level of activity. While its still a strong market, fewer listings are coming on.

Here is what our friends at the Cromford Report have to say about what we can expect.

“The supply of active listings without a contract got worse compared to last year, 15.1% down compared to 14.3% lower last month. We normally see supply drop between April and May and expect this trend to continue until September. Buyers can expect fewer homes to choose from, but at least there will also be a fall in the number of buyers looking at them. Buying activity tends to drop as the temperatures rise. Pending listings are still lower than last year but the gap has reduced from 5.9% to 2.1% over the last month. The number of listings under contract is also down compared to last year, but up 4.3% from last month suggesting a strong sales month in May.

Prices continued to rise during April but quite a bit slower than in March. The average price for homes under contract suggests another modest rise by the end of May.

The situation below $500,000 remains largely unchanged, still a tough place to be a buyer and little sign of any relief. The next price range up, between $500,000 and $1,000,000 has started to go a similar way, with falling inventory and price rises beginning to gain momentum. Demand is very strong over $1,000,000 but relatively plentiful inventory has been stopping prices from rising quickly until recently.

Despite a slight dampening effect of demand from the higher interest rates, there is still more than enough demand for homes to overwhelm the inadequate supply in the general market. For the highest price ranges, where excessive supply had been a problem since 2015, demand has increased to the point where the supply is now looking quite normal and prices can make some progress again.

For sellers, the situation continues to look very good while any bargaining power that buyers possessed is gradually drifting away from them.”

We are preparing our clients for the summer months. If you are thinking of selling or buying, please give us a call at 602-456-9388 and we can help you make the right plans.

May 7, 2018by phxAdmin
Page 3 of 25« First...«2345»1020...Last »

Subscribe to Our Newsletter

We keep your data private and share your data only with third parties that make this service possible. Read our Privacy Policy.

Thank you! Please check your inbox or spam folder to confirm your subscription.

Categories

  • Art
  • Blogroll
  • Design
  • Editor's choice
  • Events General
  • Events GYP
  • Fashion
  • Featured
  • First Time Home Buyer
  • Homes
  • Life
  • Light Rail
  • Live
  • Market Analysis
  • NeighborhoodVideos
  • Phoenix News
  • Photography
  • Photoshootings
  • Profiles
  • Public Policy
  • Renovation
  • Renting
  • Restaurant Reviews
  • Sustainable Living
  • Tips
  • Uncategorized


© 2015 copyright GET YOUR PHX ® // All rights reserved // Privacy Policy