Get Your PHX - A Whole New Way to Experience Phoenix
  • Home
  • Our Blog
  • About Us
  • Contact
Get Your PHX - A Whole New Way to Experience Phoenix
Home
Our Blog
About Us
Contact
  • Home
  • Our Blog
  • About Us
  • Contact
Blogroll, First Time Home Buyer, Live, Tips

Grand Canyon University Buyer Closing Cost Discount

Grand Canyon University Buyer Closing Cost Discount

Here’s some news about a Grand Canyon University Buyer Closing Cost Discount.

We work with many mortgage brokers and we have a handful who are our favorites.

While we always encourage you to shop around, even among our favorite brokers, we wanted to share the following program from one of them, Matt Smith of Wallack and Volk.

Here’s the deal. If you have ever worked at, are currently enrolled at or are an alumnus from GCU, you may qualify for this program, which could save you a couple thousand dollars on closing costs when you purchase a home.

If you have any friends or family members who are affiliated with GCU, you may also qualify for it as well by merely knowing that person who is connected to GCU.

Grand Canyon University Buyer Closing Cost Discount

This program offers substantial Mortgage and Real Estate discounts to employees, students and alumni along with their extended families and friends, when using the services of Wallick & Volk Mortgage Bank as well as the program’s selected Real Estate Agents and Title Providers.  These discounts can be used when purchasing, selling or refinancing a home.

DISCOUNTS OFFERED TO AFFILIATES OF GCU

**MORTGAGE DISCOUNTS**

When working with MATT SMITH of Wallick & Volk Mortgage Bank, borrowers will receive a $1,295 credit covering processing and underwriting fees.  *When using a down payment assistance program, the buyer will receive either the lender credit of $1,295 or the down payment assistance grant (whichever is of greater value).

**REAL ESTATE DISCOUNTS**

When working with Ken Clark and Michelle Conley of the Get Your PHX Team, a buyer or seller will receive a discount paid at the closing from their commission of between $700 to $1,000 to be used towards their closing costs when purchasing or selling a home.  Ken and Michelle will provide the discount in the following way:

*For homes priced at $150,000 or below, Ken and Michelle will pay $700 from their commission toward the closing costs.

*For homes from $150,001 – $199,999, Ken and Michelle will pay $800 from their commission toward closing costs.

*For homes priced at $200,000 and above, Ken and Michelle will pay $1,000 from their commission toward closing costs.

**TITLE DISCOUNTS**

With our chosen title company, a buyer or seller will receive a special negotiated rate, which allows a 20% discount off the standard escrow rates.  *We cannot guarantee that this chosen title company will be used in all purchase transactions. 

NOTE: We tell all of our favorite brokers that we encourage our clients to speak with at least three brokers before choosing one. For a list of our favorite brokers, please call Ken at 602-456-9388.

October 31, 2017by phxAdmin
Blogroll, First Time Home Buyer, Live, Market Analysis

September 2017 Market Update

For the September 2017 Market Update, we check in again with Tina at the Cromford Report.

“Supply remains lower than last year, but the gap closed slightly compared with last month in terms of active listings with no contract. We are starting to see more new listings than last year. The third quarter is up 2.5% from last year and up 5.5% from 2015. So far the extra supply is not having much effect, but if it continues for several months finding a property could start to get a little easier for buyers.

The monthly sales rate is up only 1.8% compared with a year ago. Both August 2016 and August 2017 had the same number of working days (23) so we have a fair comparison to draw. Since the year over year growth was 5.7% in June and 3.0% in July we again see a continuing slow downward trend in the advantage that 2017 has over 2016 in sales volume. Growth in the annual sales rate has almost stopped with 95,000 proving to be a difficult line of resistance. All these point to a gradual fading of demand. The serious shortage of supply obscures that fade.

We experienced a seasonal price drop between June and July, but prices have already bounced back during August and are likely to remain on an upward track for the rest of 2017 at least.

We still have a seller’s market in most locations and price ranges, but the current trends means the seller’s advantage has very little momentum. Before buyer`s get too excited, the trends are very mild in nature. As such we do not currently see major increases in buyer’s bargaining power coming anytime soon.

Of course, the market could change quickly, as it did in the summer of 2013, but there is not much sign of this in any of the numbers at the moment.”

Sept 2017 Market Update
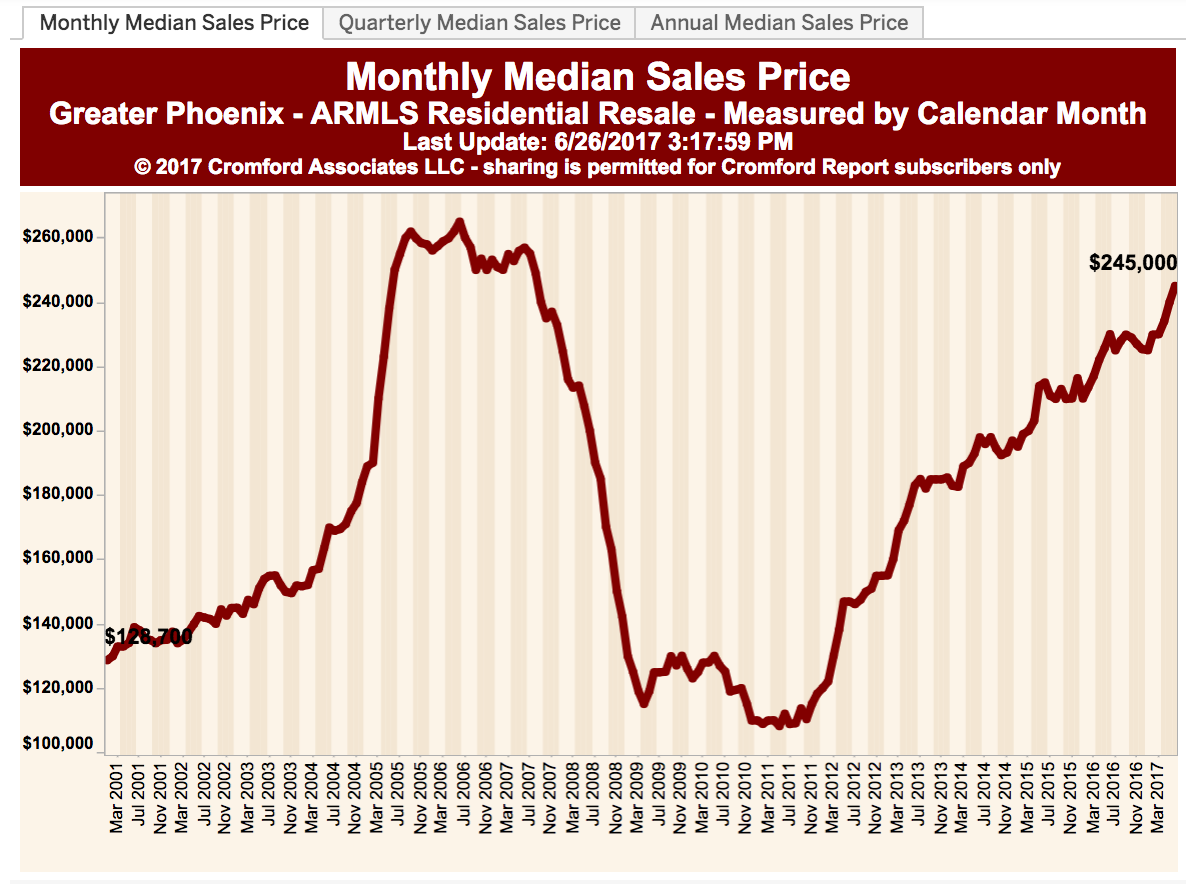
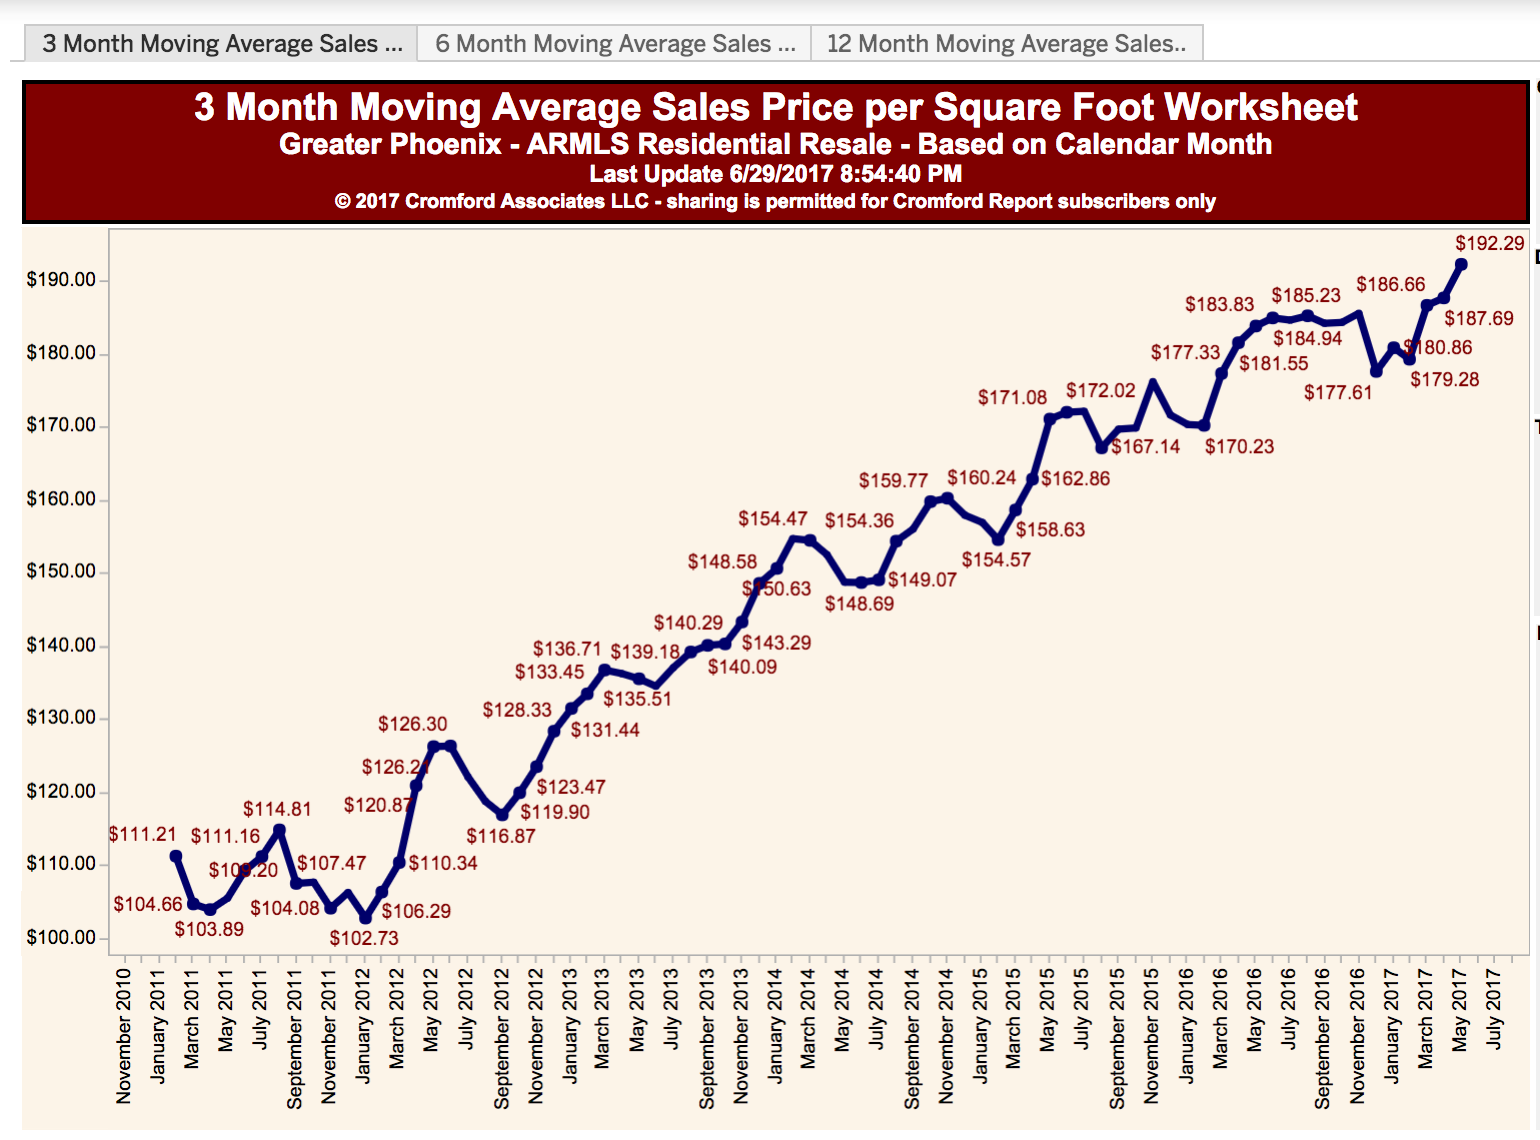
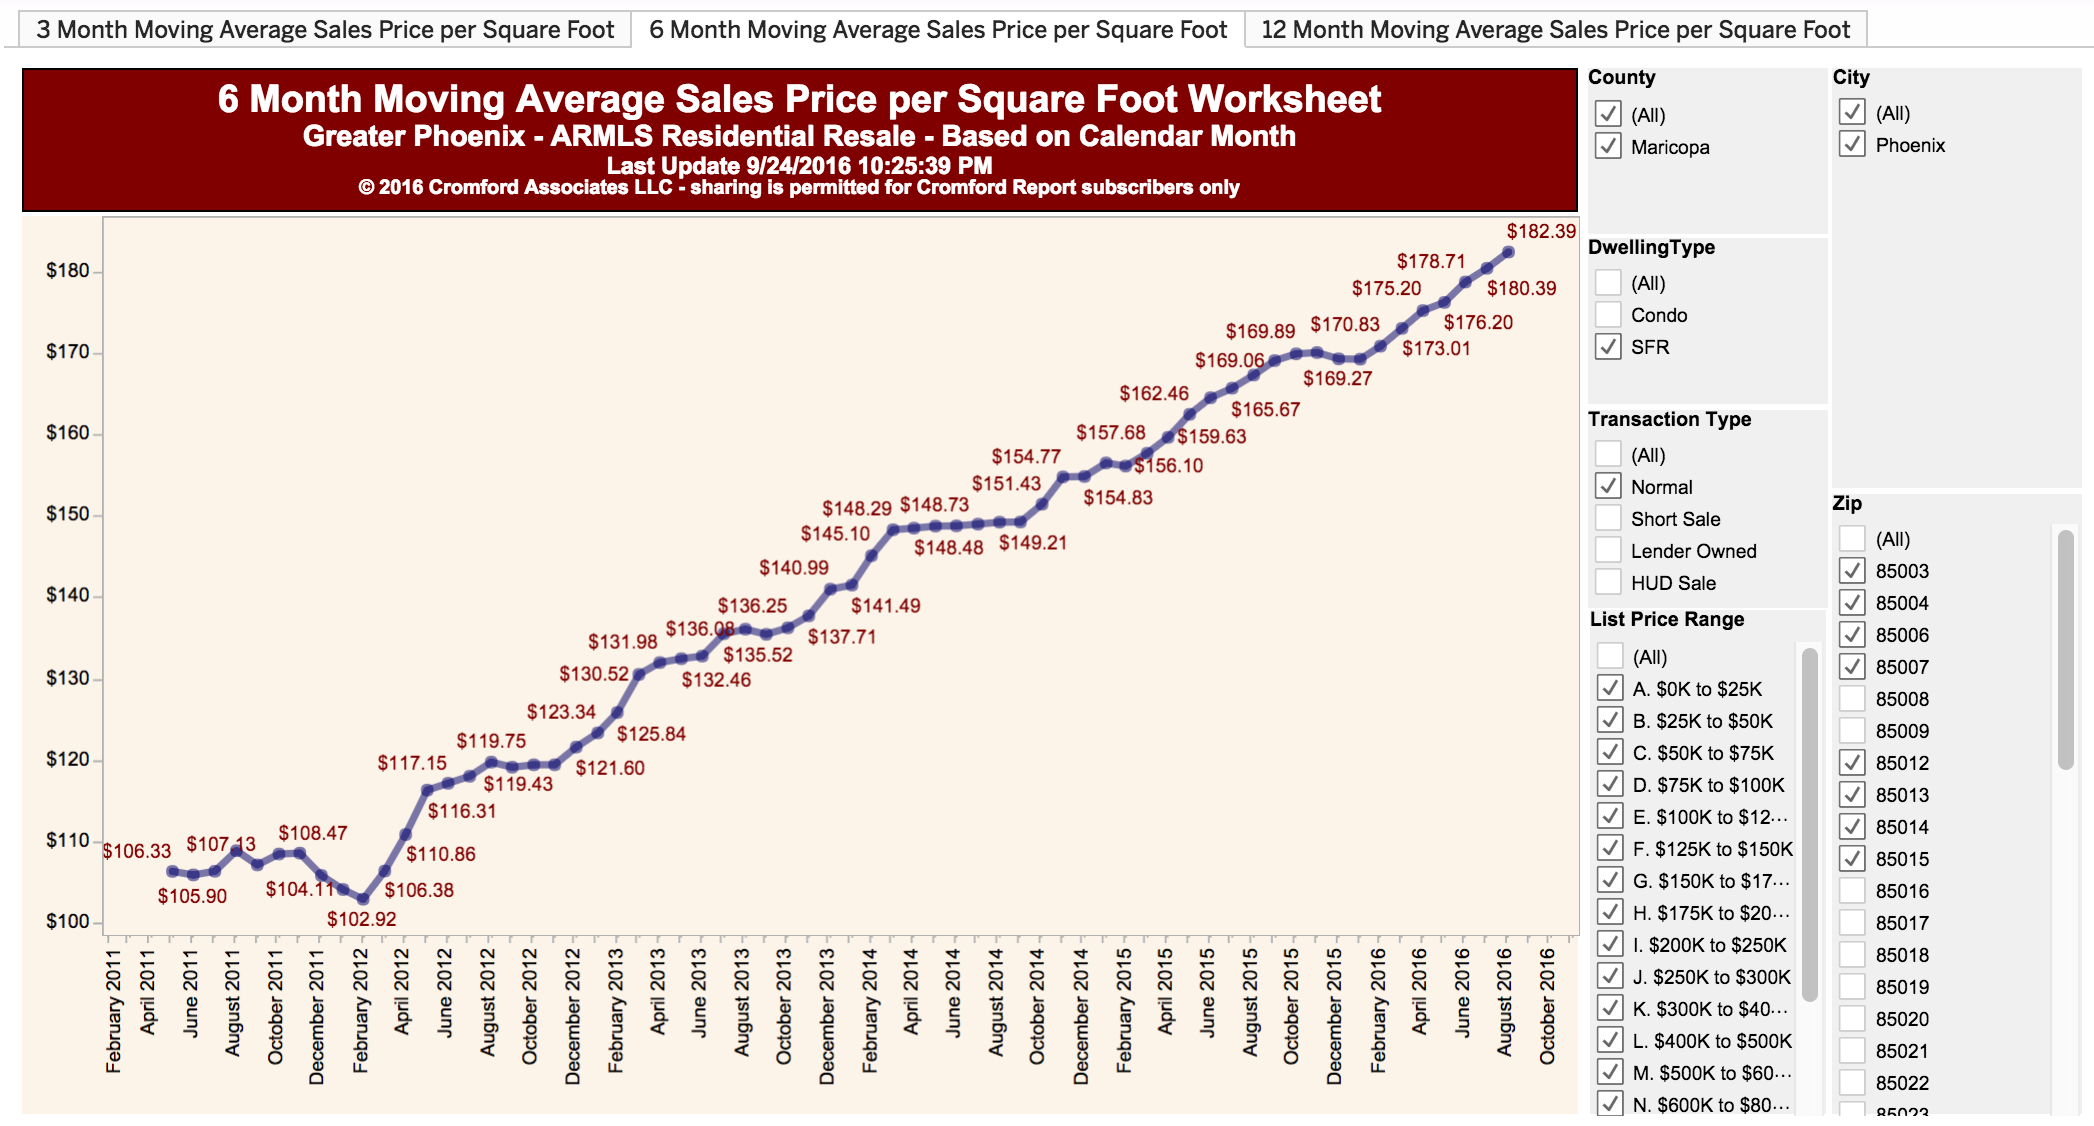
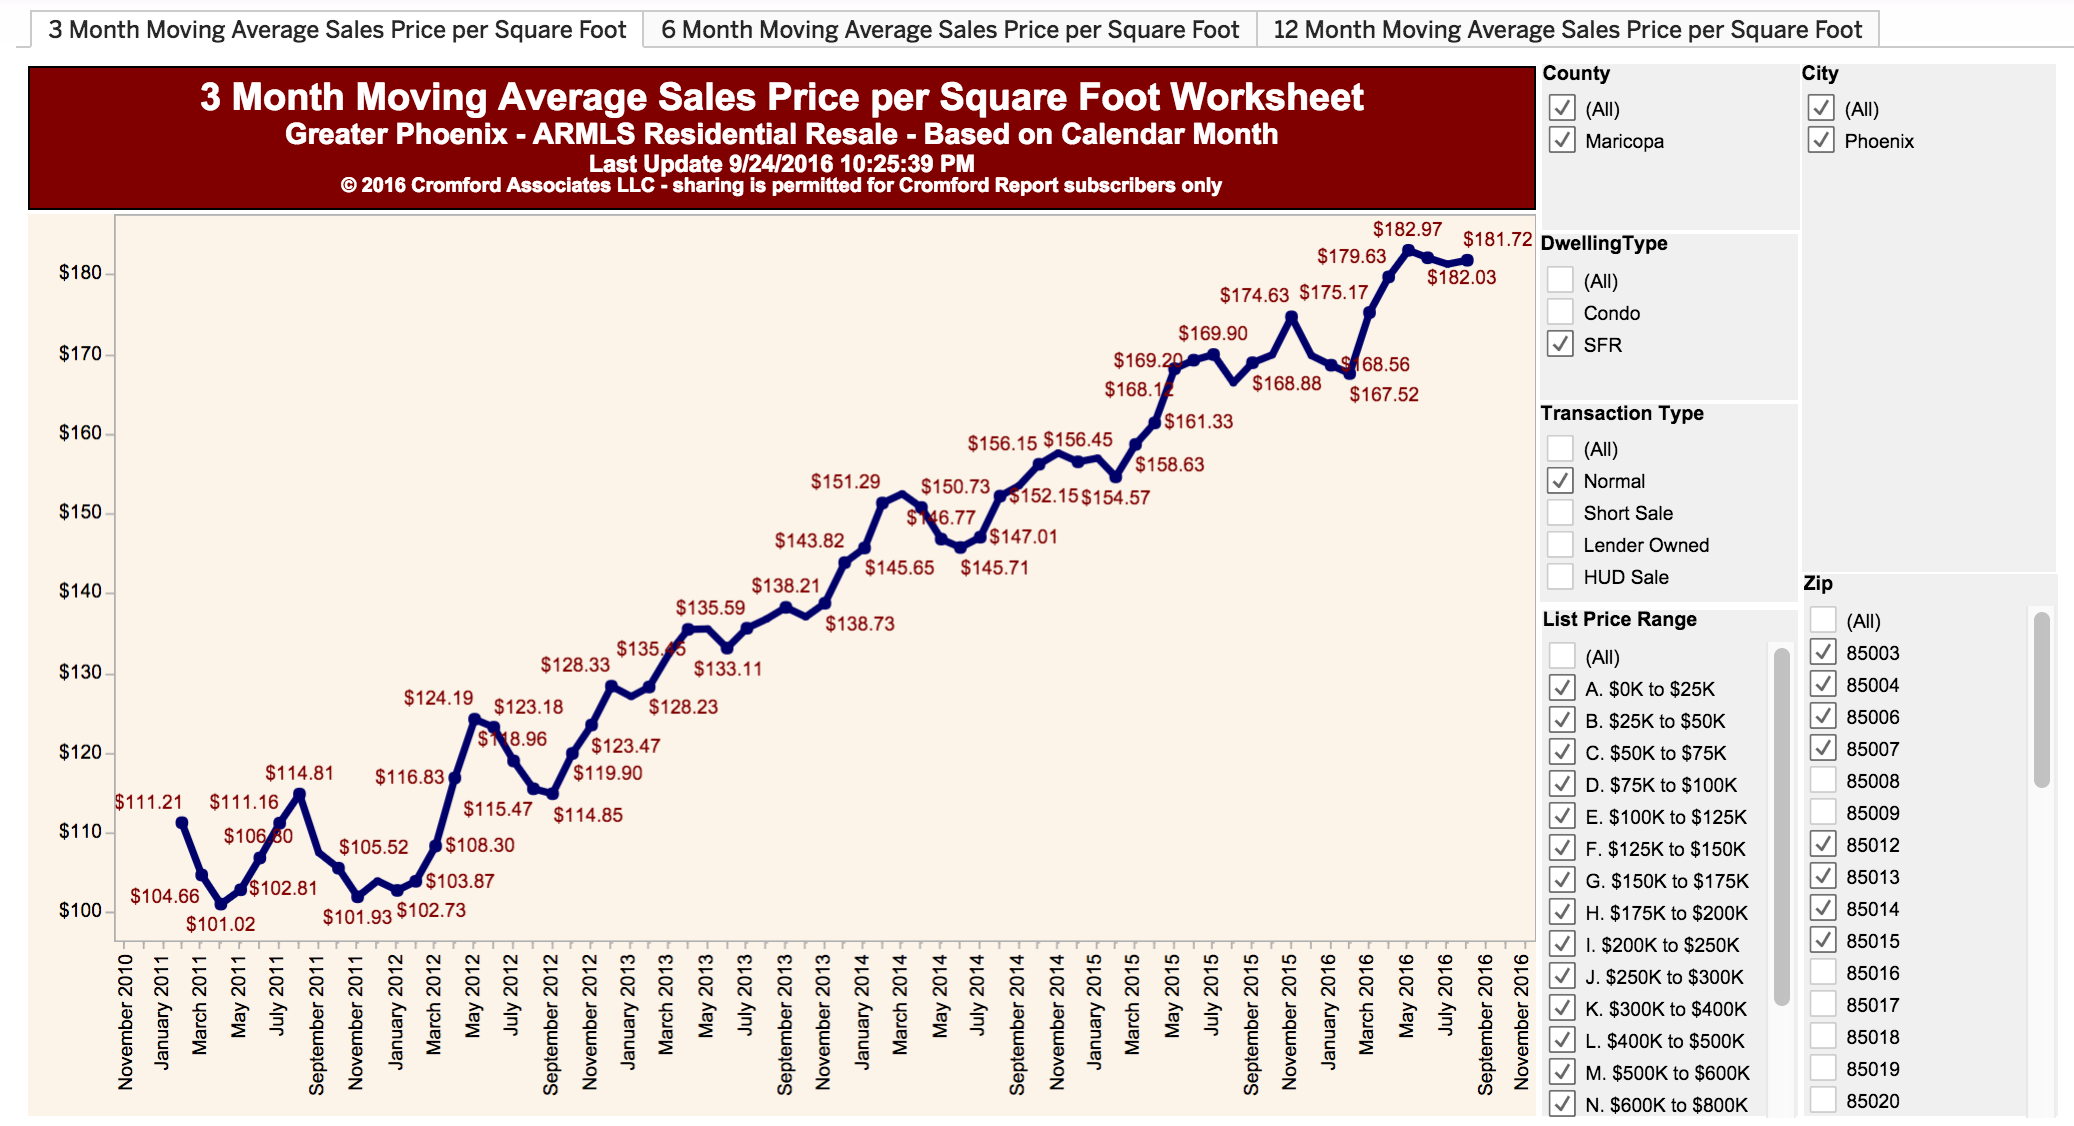
Anecdotally, we are seeing a huge number of renovation project that seem to dominate the market. I would go so far as to say that they are probably driving prices upward, as the investors are seeking high profit margins and buyers are willing to pay, given a lack of options in CenPho.

In a way some renovations are sad for the historic neighborhoods. I’ve heard many concerns from neighbors that the renovators are taking this historic souls right out of the homes –turning them in to trendy replications of an Anthropology clothing store.

If you are thinking of purchasing a renovated property, please be certain to have a realtor represent you, even if its not us. Many people don’t know that renovators are still responsible for disclosing the condition of the property, even if they claim they never lived in it. You need an agent to protect your interests.

Call us and we can give you more details at 602-456-9388.


September 6, 2017by phxAdmin
Blogroll, First Time Home Buyer, Life, Live, Phoenix News, Public Policy

Low-Income Historic Housing Rehabilitation

Historic RehabilitationThe Low Income Historic Housing Rehabilitation Program was created to encourage the repair and rehabilitation of historic residential properties providing housing opportunities for persons and families with low-incomes. The program funds critical building maintenance; structural stabilization work; repair and rehabilitation of historic exterior features such as roofs, walls, windows and doors.

All projects are required to meet city historic preservation guidelines, as well as the Secretary of the Interior’s Standards for the Treatment of Historic Properties. The city will pay 70 percent for eligible work when the 30 percent match is paid by a non-profit organization and for projects where matching funds are provided by an outside agency or other city assistance program. The city pays 80 percent for eligible exterior rehabilitation work on projects where individual grant recipients do not receive funding assistance from a non-profit organization, another agency or assistance program to cover the remaining costs.

The minimum request the city will consider is $3,000 and the maximum funding amount is $30,000. In exchange for receiving funding assistance, owners convey a conservation easement to the city for a period of 15 to 20 years depending on the funding amount.

If you are interested in obtaining the complete application packet about the housing rehabilitation program, which includes the application, program guide and preservation philosophy, call 602-261-8699 or download the packet items from the City of Phoenix website here.

If you need help finding a property that you can fix up and make your own using this grant, give us a call at 602-456-9388.

August 1, 2017by phxAdmin
Blogroll, First Time Home Buyer, Live

August 2017 Market Update

For the August 2017 Market Update, we are turning to look at the role of rentals on the sales market, with the help of Tina at the Cromford Report.

For those of you who own rental property, or who are deciding what to do with your rental property, this month’s analysis is particularly relevant.

Here’s the Cromford take on the August 2017 Market Update.

August 2017 Market Update

For Buyers:
Good news for buyers, listings for sale between $150K and $300K stopped declining over the past 4 weeks.  This is good news because as the summer progresses, there are fewer buyers to compete with in the marketplace which offers a seasonal relief for those still willing to brave high temperatures and scalding door knobs to view homes.  Supply is still extremely low, but this slight improvement gives as much relief as a hot breeze on a July afternoon.  It’s not much, but it’s something.  Meanwhile, luxury buyers may notice fewer properties to look at this summer as demand was higher during the Spring season and overall inventory has been dropping due to a higher number of closings and seasonal cancellations/expirations.  Expect inventory in price ranges above $500K to continue declining seasonally until settling into a stagnant level in August and early-September.

For Sellers:
There has been a lot of talk about the increased production of luxury apartments and what impact they will have on the residential real estate market.  One segment that is starting to see their influence is apartment-style condominium rentals leased through the Arizona Regional MLS.  While rents on single family homes and townhouses continue to rise, successful leases of apartment-style condominiums have dropped 11% in average rates from a high of $1.26/sf in January 2017 to $1.12/sf by June. The drop is consistent across all lease price ranges for this type of rental and is not seasonal.  Areas that have been particularly affected are Tempe, Old Town Scottsdale and the Central Corridor including Downtown Phoenix.  Considering the lack of supply for sale in affordable price ranges and the added competition from brand new apartment complexes, this may be a good time for landlords of apartment-style rentals to consider selling if they’re unwilling or unable to reduce their rental rate.

Commentary written by Tina Tamboer, Senior Real Estate Analyst with The Cromford Report
©2017 Cromford Associates LLC and Tamboer Consulting LLC 

What we’ve seen for the August 2017 Market Update anecdotally may seem to contradict this analysis.

We had clients who purchased an affordable condo at about $90,000 in CenPho. We closed very quickly (three weeks) and, since the property was vacant, prepared them with resources to get ready to rent the property as soon as they closed. They advertised the condo for rent and had about 8 possible renters within days. They interviewed, chose and the new tenant moved in this week.

In other words, they were clamoring for an affordable rental.

The reason this does not contradict Tina’s analysis may have to do with price point. The new build apartment complexes that she is referring to are often renting much higher than a 40-year old condo. We have often felt that the new rentals are priced too high for the market, and I think that is why the rental rates for the new properties have dropped. As we’ve said before, the apartments are over-built.

That will probably continue to depress rental rates. If you own an older property, however, you are probably right where the rental rates need to be.

So, if you are thinking of purchasing a rental property, now may be the time. Give us a call at 602-456-9388 and we’ll help.

August 1, 2017by phxAdmin
Blogroll, First Time Home Buyer, Live, Market Analysis

What do Renters Need to Earn?

I saw this article in AZCentral which asked what renters need to earn in Phoenix in order to live here.

Y’all know that I’ve been critical of the number of apartment units that have been going up in Central Phoenix, as well as the fact that they are priced way above what is affordable here.

But, here’s the next question: What do these same renters need to earn in order to purchase?

Of course you would expect a realtor to ask that. We all just want to get everybody to buy a home, right?

Wrong.

I don’t actually believe that everybody need to purchase a home. However, the last I checked (about two years ago) there was a 6-to-1 ratio of apartments being planned downtown to owner occupied homes being considered. Those apartments have since been built.

While home ownership is not for everyone, I do think those numbers are way off.

But, I digress.

This article addressed what millennials need to save in order to purchase a home. The article is terribly misleading because it assumes that they need to save 20% of the median home price (about $27,000) to buy. So, it predicts that it will take them 13 years to save that.

Near the end of the article, they admitted that people can still get FHA and Conventional loans for 5% down, and under. But, very, very few people actually purchase with 20% down. So, why start the article on such a misleading point?

Oops. I digressed again.

The reason I asked what that same apartment renter needs to purchase a home is because I know that apartment companies are charging much more than what these folks would pay to own a home, if only they had good credit and down payment.

In other words, renters pay a premium for living space (more than owners) when they don’t have good credit and funds to purchase a home.

So, the question to be answered is what is the real minimum income that a person would need to make in order to purchase a home in Phoenix?

The answer, of course, depends on where in Phoenix they purchase and how much they have to put down.

Let’s assume they are making just enough to afford the county-wide median home, at $245,000. Let’s assume they bring the minimum down payment for FHA at 3.5% and that they have just enough to cover closing costs. Let’s also assume about $8,600 for down payment an another $4,500 for closing costs.

That $245,000 home (assuming no HOA fees) will cost you about $1,500 per month, depending on property taxes. I think that many, if not all of the apartments downtown cost more than per month that AND are probably smaller.

Just a disclaimer: I’m not a lender. So, this is just an illustration. If you are thinking of buying a home, I can share some leads for you of great lenders.

So, what is a minimum of that renter needs to earn in order to purchase? According to my calculations, about $40,000. Again, I could be off, so talk to a lender. But, my point is that home ownership is much more attainable than many think –and that’s where the apartment builders get you!

If you are thinking about purchasing a home, please call us first at 602-456-9388.


July 6, 2017by phxAdmin
Blogroll, First Time Home Buyer, Live, Market Analysis

July 2017 Market Update

As we do each month, we check in with the Cromford Report for their monthly update. Here’s your July 2017 Market Update.

July 2017 Market UpdateFor the monthly period ending June 15, we are currently recording a sales $/SF of $151.10 averaged for all areas and types across the ARMLS database. This is up 0.4% from the $150.45 we now measure for May 15. Our forecast range midpoint was $151.94, with a 90% confidence range of $148.90 to $154.98. We were correct in forecasting a rise, but the actual rise was only about half as big as forecast.

On June 15 the pending listings for all areas & types shows an average list $/SF of $154.91, up 0.6% from the reading for May 15.

Supply has been falling quite sharply in the last few weeks while demand is little changed. However, we will shortly be entering the third quarter, a period famous for weaker pricing. This is because the luxury market loses a lot of sales volume during the hottest months, whereas the rest of the market slows to a lesser extent. This is a seasonal effect and does not indicate underlying weakness. We would expect the upward price trend to resume once we get to the end of September.

Now back to you, Ken.

Thanks, Tina.

July 2017 Market UpdateSo, here’s our more anecdotal view of the July 2017 Market Update for Central Phoenix and the historic neighborhoods. We are seeing property prices continue to move up in CenPho at a faster clip than the county-wide numbers. The chart here is for all prices. When I looked at different price brackets, the move remained.

In short, people want to live in CenPho. But you knew that, didn’t you?

We don’t believe that this means sellers can price absurdly high and expect to get what they want. Two of our recent listings downtown did have small price drops off of the original list price. That’s normal.

July 2017 Market UpdateThe Cromford Index continues to indicate a strong seller’s market, stronger than the last two years. This is, in large part, due to the shortage of available homes. You’ve heard me recently complain about the over-built rental market. Some of those projects could have been condos. This is the result.

As we often say, your decision to buy or sell should be about need rather than a desire to play the market. We can help you make the best decision with market-based data and experience.

Call me (Ken) at 602-456-9388 and let’s chat.

June 30, 2017by phxAdmin
Blogroll, First Time Home Buyer, Live, Tips

Interest Rates are on the Way Up

Interest rates are on the way up!

We’ve been hearing talk of it for a while, but now its probably going to be a reality — not once, but maybe three times in the next 18 months.

So, what does this do to the price of a home? As you can guess, a lot!

For instance, if you buy a $200,000 house at 4.5% interest with a 5% down payment, your monthly payment (before taxes and insurance) would be $962. The same house at 5% interest would cost $1,019 per month.

That extra $57 per month difference may not seem like much. However, that is $684 per year or $20,520 over the life of the loan!

I don’t know about you, but I can think of a few things that I could do with that money. There are a few countries on my bucket list that I’d like to visit and I don’t want interest rates to keep me from going.

Interest rates are on the way upAnother way to look at it is that in order to have the same payment every month that you had at 4.5% interest, you could only afford a house that costs $189,000 at 5% interest.

So, what does this mean? It means that you want to consider getting in to the market before interest rates go up.

It also means that you probably want to act before both prices and interest rates go up, which they are doing now. That is to be avoided!

Further, we’ve been hearing news stories that the Federal Reserve bank may be thinking of raising interest rates multiple times in the next 18 months or so. If prices in Phoenix continue to go up at the same time these interest rates are going, that could be a problem for you.

What’s the take-away? If you can buy now, you might want to make it happen.

Give me a call. I’m more than happy to help you navigate the market: 602-456-9388.

March 2, 2017by phxAdmin
First Time Home Buyer, Live, Market Analysis

The Rhythms of the Market in Phoenix

Real estate is like surfing. If you observe the waves long enough, you get to know the rhythms of the market. You can see how certain seasons advantage buyers vs sellers, or even when conditions might be better for new home buyers.

Have a look at this graph to illustrate. This is called the “contract ratio”. Its the ratio of all properties that actually sell and close, out of all of those listed each month.

cromford-conratio-all-2016-11-29 Rhythms of the MarketFor our purposes, the ratios represented in of this chart are not as important as the pattern you can see – the rhythms of the market. Notice that the percent of homes that sell and close tends to go down at about the same time every year: July – January. The percent goes up at about the same time every year: February – June. If you look closer, you will also see that Sept – Oct often stay very stable.

Why?

Well, more people are looking and purchasing from February to June. That means more buyers and more sellers. But, look. If you consider that most homes take 4-6 weeks to close from the time they are listed, then you can see that the homes listed in January represent the up-tick that you start to see each February.

The converse is true, too. If you are listing a home to sell in June, you have already crested that wave and fewer people are out looking for homes.

What I’ve observed by watching the rhythms of the market over the years is that you should list in January if you can. If you can list in the first half of the year, then aim for September. People tend to be back from vacation, and they get serious until Thanksgiving, when the tryptophan in their turkey puts them to sleep until about mid-January.

What you absolutely want to avoid doing, if you can, is listing in October or November. You will likely just accumulate days on market with fewer people out looking for homes.

Michelle and I have several new listings coming on in January and February. We know already that 2017 is supposed to see Phoenix as one of the busiest markets in the country. Now is the time to look (before interest rates go up) and now is the time to list (when people are the most active).

If you have questions about listing your home, give me a call at 602-456-9388. We can help you surf those market waves.


December 31, 2016by phxAdmin
Blogroll, First Time Home Buyer, Live, Market Analysis

January Market Update

phoenix-metro-infographic-2016-12 January market updateYour January Market Update finds the market generally healthy and likely to start the year strong, according to our friends at the Cromford Report.

“There is both good and bad news for first-time home buyers this month.  The good news is that there’s been a 22% increase in single family active listings asking between $175,000-$200,000 over the last 10 weeks, going from 1,065 to 1,295.  Current inventory is 10% higher than where it was in week 49 of last year, adding some much needed choice to a high demand price range.  The added supply is not universal across the valley; increases have been marked specifically in Buckeye, Surprise, Sun City, Peoria and Mesa.”

As you know, we do most of our work in Central Phoenix, North Phoenix, Downtown and East Phoenix (although we work everywhere in Maricopa County). The bad news for first time home buyers in the January Market Update is that this increase in affordable inventory is not as apparent in the sought-after areas of CenPho and downtown. We can only hope that this bubble of apartment building in CenPho will break and we will see some affordable owner-occupied developments in 2017.

Despite the bad news in this category, don’t give up. We know the area really well and we can point first time home buyers to the up-and-coming areas that are more affordable and undergoing redevelopment.

Back to Tina Tamboer at the Cromford Report:

“The bad news for home buyers is that supply overall is down 3.7% while the level of competing buyers is remaining seasonally consistent.  The Southeast Valley specifically has not seen the typical increase in supply that happens this time of year.  This indicates that the area will kick off 2017 with low supply just before the expected increase in buyer activity come February.  In this case, the cost of waiting to purchase will be a lack of choice and possibly having to compromise on the condition or location of the property they choose to buy.”

For Sellers in this January Market Update:

“Bad news for buyers usually translates into good news for sellers, especially after positive news reports of Realtor.com ranking Phoenix as the #1 projected real estate market in the country for 2017.  However, it’s still not a market to be overpriced regardless of the strong demand for homes.  Some price ranges have more competing listings than others, especially in areas such as North Phoenix, Mesa, Gilbert and Peoria where there is competition from new home subdivisions.  Permits for single family homes have been on the rise to accommodate the demand.  This provides more choice for buyers in those areas, balances out the market and keeps annual appreciation in check.  The areas projected to have the highest appreciation rates are those where there is a high level of fix and flip activity along with a more affordable price range under $175,000.”

In the end, we can help you navigate this new year –whether you are buying or selling. Just give Ken a call at 602-456-9388.

December 31, 2016by phxAdmin
Blogroll, First Time Home Buyer, Live, Market Analysis

September Market Update

Just in the last 4-5 weeks we found ourselves swamped: listings, buyers, lots of activity.

Something about the impending cooler weather gets people’s juices flowing.

That activity is born out in what the Big Brains™ at the Cromford Report are seeing in their tea leaves.

“For the monthly period ending September 15, we are currently recording a sales $/SF of $139.28 averaged for all areas and types across the ARMLS database. This is up 1.1% from the $137.83 we now measure for August 15.”

6-month moving average

6-month moving averages for price per square foot for the areas of CenPho which contain most of the historic and downtown neighborhoods. No wild swings here.

It is interesting to note that, despite the strong seller’s market, the active list prices are still a little bit above the final sold price. “On September 15 the pending listings for all areas & types shows an average list $/SF of $146.50, up 0.6% from the reading for August 15.”

That means that properties sold for about 6% less (in PPSF) than what they were listed for. That’s expected as people negotiate prices. Further, these numbers are from all areas. So, you may not see that drop off everywhere.

That’s good news for buyers. Even in this strong market, it does not hurt (unless you know there are other offers coming in) for you to try to slice a little off that price.

Its also interesting to see that the distressed sector of the market is back to pre-recession levels. “Among those pending listings we have 92.4% normal, 2.8% in REOs and 4.8% in short sales and pre-foreclosures.”

In other words, no, there really are not many distressed properties out there anymore –he says for the benefit of those who call him every few weeks asking if they can find a foreclosure to purchase for half the going market rate for homes.

3-month moving average

Same historic and CenPho zip codes, 3-month moving average.

The Crazy Cromford Calc Crew™ is predicting slightly higher prices still in October. “Our mid-point forecast for the average monthly sales $/SF on October 15 is $140.36, which is 0.8% above the September 15 reading. We have a 90% confidence that it will fall within ± 2% of this mid point, i.e. in the range $138.27 to $143.91.”

Again, this is county-wide. It could be higher or lower, depending on the area.

The nice thing is, dear reader, that your Get Your PHX Team really knows the neighborhoods. So, we can help you take advantage of these trends, regardless of whether you are buying or selling.

Contact us for more at 602-456-9388.


September 29, 2016by phxAdmin
Page 2 of 17«1234»10...Last »

Subscribe to Our Newsletter

We keep your data private and share your data only with third parties that make this service possible. Read our Privacy Policy.

Thank you! Please check your inbox or spam folder to confirm your subscription.

Categories

  • Art
  • Blogroll
  • Design
  • Editor's choice
  • Events General
  • Events GYP
  • Fashion
  • Featured
  • First Time Home Buyer
  • Homes
  • Life
  • Light Rail
  • Live
  • Market Analysis
  • NeighborhoodVideos
  • Phoenix News
  • Photography
  • Photoshootings
  • Profiles
  • Public Policy
  • Renovation
  • Renting
  • Restaurant Reviews
  • Sustainable Living
  • Tips
  • Uncategorized


© 2015 copyright GET YOUR PHX ® // All rights reserved // Privacy Policy