Get Your PHX - A Whole New Way to Experience Phoenix
  • Home
  • Our Blog
  • About Us
  • Contact
Get Your PHX - A Whole New Way to Experience Phoenix
Home
Our Blog
About Us
Contact
  • Home
  • Our Blog
  • About Us
  • Contact
Blogroll

Seasonal Contract Ratio Still Low

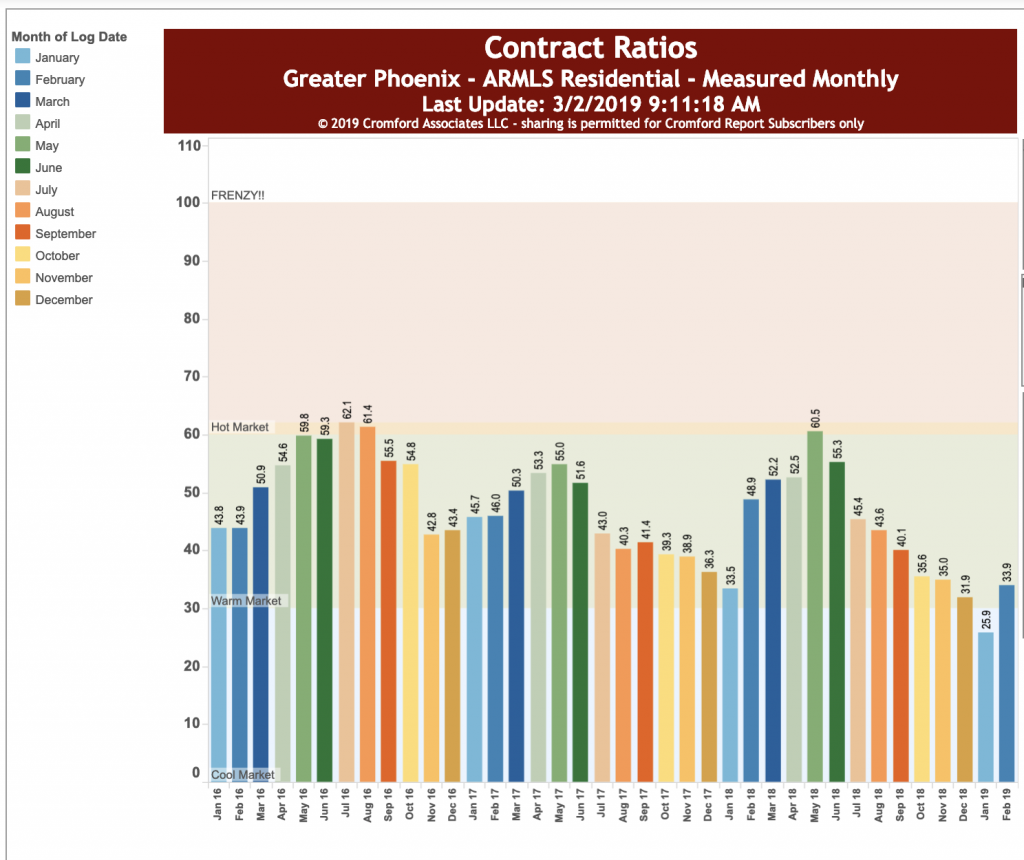
If you want to know what the Contract Ratio is, please see below.

For now, the important take-away is that the county-wide contract ratio for January and February 2019 are still lagging 2018.

What does that mean to you? If you are thinking of selling, price aggressively.

If you are thinking of buying, you have a little bit of an advantage.

You won’t be able to negotiate the price down by 10%, but you are looking at sellers who should know (if they have a good agent) that the market is a little soft for them right now.

Call us at 602-456-9388 for more details.


Definition: The Contract Ratio indicates how “hot” a market is.

It specifically measures the number of completed sales contracts relative to the supply of active listings.

The higher the number the greater the buying activity relative to supply. If this number rises then it is a sign of growing contract activity and a positive signal for sellers. Conversely a falling number is a sign of a weakening market – either supply of active listings is increasing or contract activity is slowing, or both.

In a balanced market for normal market segments, the value of the Contract Ratio is usually between 30 and 60.

When it lies below 20 the market can be considered “slow” or a “cold market”.

Above 60 can be considered a “hot market” and when it moves above 100 we regard this as evidence of a “buying frenzy”. In high-end luxury market segments the normal level is lower, usually lying between 15 and 25.

March 19, 2019by phxAdmin
Blogroll

Are Prices About to Shift Again?

Our friends at the Cromford Report were correct when they predicted the current weakness in prices and their mid-month data may be showing the prices could start going up again.

Watch this space. This story is not over yet.

For now, here is an extended excerpt from the Report.

“Each month about this time we look back at the previous month, analyze how pricing has behaved and report on how well our forecasting techniques performed. We also give a forecast for how pricing will move over the next month.

For the monthly period ending March 15, we are currently recording a sales $/SF of $171.77 averaged for all areas and types across the ARMLS database. This is up 2.5% or $4.16 from the $167.61 we now measure for February 15. Our forecast range mid-point was $169.20, with a 90% confidence range of $165.82 to $172.58. The actual result was higher than the mid-point but within the 90% confidence range.

On March 15 the pending listings for all areas & types shows an average list $/SF of $174.59, down 0.6% from the reading for February 15. Among those pending listings we have 97.4% normal, 1.0% in REOs and 1.6% in short sales and pre-foreclosures. This mix is similar to last month and has far fewer distressed properties than the historical average.

Our mid-point forecast for the average monthly sales $/SF on April 15 is $170.73, which is 0.6% below the March 15 reading. We have a 90% confidence that it will fall within ± 2% of this mid point, i.e. in the range $167.32 to $174.14.

The average $/SF was stronger than predicted over the last 2 months, but this was largely due to the mix of homes that closed. High end homes were more strongly represented in January and February. The average $/SF for pending listings has fallen back a little as the mix reverts to normal. The overall price trend continues to move higher, as is normal for the spring season.”

March 19, 2019by phxAdmin
Blogroll, Life, Sustainable Living

Recycling Crisis

There is a huge crisis in trash and recycling in the US today, and there are things you can do about it. In fact, I would suggest that we all need to act quickly to change behaviors.

I’ve had so many conversations with people over the years who are convinced that none of the things they recycle are actually recycled. They were convinced that the city pays all this money for blue bins, but then just dumps it all in the landfill, anyway.

This has not been true in the past. Phoenix has a goal of diverting about 40% of its waste by 2020. The last I saw, they recycle about 24% of its waste.

That’s far too little, for sure. The city does not recycle from office buildings and multi-family.

On reason for the lack of progress: our backward legislature made is impossible for cities to require multi-family dwellings (apartments and condos) to recycle back in 2015.

So, if offices and multi-family dwellings don’t pay for pick-up themselves, it simply does not get done.

Yet, things have changed in a dramatic way with the announcement by China of its “National Sword” policy, in which it will no longer accept recyclable materials from other countries.

This is a big deal if you are concerned about the future of our life on this planet.

Since the US, Europe and many nations were sending their plastic, aluminum and paper to China for recycling, rather than developing their own domestic recycling facilities, we are up trash creek without a paddle.

According to PRI, “Every day, nearly 4,000 shipping containers full of recyclables leave US ports bound for China. China sends the US toys, clothes and electronics; in return, some of America’s largest exports back are paper, plastic and aluminum.”

As if it were not enough that our oceans and fish populations are chomping down on poisonous plastics every day, now our capacity to recycle is greatly reduced.

To that end, please listen to this podcast called 99% Invisible, which will help you understand the reasons for the crisis and what you can do about it. Listen while you are cleaning or taking a walk. It is worth 45 minutes of your life.

Here are some things that we can do to make a huge impact:

  1. Find ways to buy less.
  2. Countries and cities need to pressure manufacturers and designers to find ways to use less materials in their designs.
  3. Countries and states need to invest in more domestic recycling facilities.
  4. Look in to products that use less –such as toothbrushes with replaceable heads or toothpaste dispensers that are re-useable.
  5. Let’s move past refusing straws and find ways to re-use the whole cup, which represents about 99% more plastic than just the straw.

99% Invisible said it best, “In the end, Operation National Sword Could be a wakeup call. But only if producers, consumers, and governments tune in and listen.”

March 14, 2019by phxAdmin
Blogroll

Mutant Piñata Show

We love the creations that come out of the Mutant Piñata show.

Be sure to check this event if you are in to keeping Phoenix weird.


PRESS RELEASE:   FOR IMMEDIATE RELEASE

FOR MORE INFORMATION PLEASE VISIT:

FB: Mutant Pinata Show 2019 or Weird Garden

Media Contacts:

Beatrice Moore:  602.391.4016 or muppetsrealmom@gmail.com

Mutant Piñata Show Promises Raucous Display During Art Detour 31

pinata

Phoenix, AZ (March 12th, 2019) – The 12th Annual Mutant Piñata Show, one of Phoenix’ most anticipated annual exhibits, will be hosted by Weird Garden again this year. Organized by local artist Beatrice Moore, and help at her studio at 1008 N. 15th Ave, the opening night will be Third Friday, March 15th (6-10pm). Visitors can also drop by throughout the Art Detour Weekend March 16th – 17th (11am – 5pm both days).

There will be free, on-site Mutant Pinata making sessions, with all supplies provided, on Saturday, March 16th from Noon – 5pm. All ages can participate and either add their creations to the show for display or take them home. The exhibit will continue through First Friday April 5th (6 – 10pm).

Moore will also have a selection of her popular faux cakes on display as part of the weekend offerings, with some of the fantastical creations displayed on turning motors. In the outdoor patio area soft sculptures created by the artist will delight both young and old alike.

Pinata are made from traditional, as well as non-traditional, materials including papíer maché, paint, cardboard, recyclables, fur, wigs, pipe cleaners, bubble wrap, cloth scraps, sequins, faux jewels, feathers, styrofoam, and plaster. Themes run the gamut from wacky, to cartoony, philosophical, political, funny, elegant and even naughty.

Some of the works will be for sale with all of the proceeds given to the artist. For more information about the show and times contact Beatrice Moore at muppetsrealmom@gmail.com or visit the Weird Garden or Mutant Piñata Show 2019 FB pages for updates.

-end-

March 12, 2019by phxAdmin
Blogroll, Live, Market Analysis

This Fluctuating Market, Man! Part 11 of 11

The Cromford Report tracks single family rents. Note, however that not all rentals are on the MLS. Lower priced rentals tend to go to Craigslist, etc.

The “Affordability/Rent” slide shows you how the average lease prices have really gone up recently —more so in CenPho and the historic neighborhoods.

market

This chart looks really dramatic, but notice that we are going from 65 cents per square foot to 90 cents per square foot over the course of five years. Not that this is nothing.

See our video on the causes of homelessness increases here https://youtu.be/OsdUlEZ1qSI

However, any time I see a chart that looks this dramatic, I like to draw attention to the numbers, not just the graphics.

So, what does this mean for you?

BUYERS: If you are not ready to buy, don’t despair. Save your money as aggressively as possible. Also, the lenders we work with have access to down payment programs for low income buyers. See if you qualify.

SELLERS: Even according to these charts, your home may be less expensive than renting. We can communicate to those renters that buying is an option. Also, from now until early June is the high season. Sell now if you are going to sell this year!

Call us directly for more insights at 602-456-9388.

March 6, 2019by phxAdmin
Blogroll, Live, Market Analysis

This Fluctuating Market, Man! Part 10 of 11

The Cromford Report also compares renting vs buying.

This slide that shows how the average Principle and Interest (P&) in Dec of 2018 was very close to that of January 2005. Obviously, interest rates are lower. However, you can see how the margin between average monthly payment and average estimated monthly payment for a 1,900sf home have been diverging in recent years. 

market

So, what does this mean for you?

BUYERS: If you are not ready to buy, don’t despair. Save your money as aggressively as possible. Also, the lenders we work with have access to down payment programs for low income buyers. See if you qualify.

SELLERS: Even according to these charts, your home may be less expensive than renting. We can communicate to those renters that buying is an option. Also, from now until early June is the high season. Sell now if you are going to sell this year!

Call us directly for more insights at 602-456-9388.

March 6, 2019by phxAdmin
Blogroll, Live, Market Analysis

This Fluctuating Market, Man! Part 9 of 11

The Cromford Report keeps an eye on affordability in the market. Here are three interesting slides about that.

market

It is notable that our home sales affordability in 2018 in Phoenix was just below the normal range. This is contrary to the anecdotal stories we hear about how expensive homes are. That’s probably because the horror stories we hear are probably from the dense urban cores, whereas the suburbs are more affordable. 

Over-all, the valley is still affordable.

While there are many people moving in to Phoenix (locations to Maricopa County are really high, nationally), we need salaries to increase across the board for this to get better. Either that, or prices will come down. We are, of course, seeing the latter.

So, what does this mean for you?

BUYERS: If you are not ready to buy, don’t despair. Save your money as aggressively as possible. Also, the lenders we work with have access to down payment programs for low income buyers. See if you qualify.

SELLERS: If you bought between about 2010 and 2015, you are still likely to get a great return.

This reminds us of the old saying about investing, “you’ll never know where the highest and lowest points are, but if you are pretty close, you are doing well.” 

Call us directly for more insights at 602-456-9388.

March 6, 2019by phxAdmin
Blogroll, Life, Public Policy

Homelessness in Phoenix

Have you noticed the increase in homelessness in Phoenix over the last few years?

There are some very clear reasons for it –and it’s not just that the price of housing has gone up.

It is just as much about poor planning and poor funding, which has caught up with us.

Have a look at this video to learn more about why we’ve seen such a drastic increase in recent years, and what you can do about it.

This video was shot as part of an experiment with me and Marshall Shore. We are shooting videos about things you may not know about downtown, as well as public interest issues, like Homelessness.

You can see these videos pop up about every week on Facebook, “Get Your PHX” on Instagram, LinkedIn and Twitter.

March 5, 2019by phxAdmin
Blogroll

This Fluctuating Market, Man! Part 8 of 11

So, this follows the previous post about flips, which show the the number of investor flips in the market per month has dropped 30%. This trend is supported by the Cromford Report data, that only tracks investor flips. We are talking about those NOT owned by the big wholesale real estate buyers.

market

As an aside, these wholesalers make their money on sellers who are often willing to effectively pay more than 6% in commissions. The wholesalers tell sellers they won’t have to pay a realtor, but end up paying more. Don’t get us started!!

See our video on that at our YouTube Page.

What does this mean for you?

SELLERS: Please, please, please be very careful if somebody tells you they can sell your home for less than the price of a realtor.

Also, from now until early June is the high season. Sell now if you are going to sell this year!

BUYERS: There are a lot of terribly-done flips out there. But if you are willing to look, you are in a stronger position to make those flippers drop those prices. We are not talking about 10% discounts here. But if you 

Call us directly for more insights at 602-456-9388.

March 5, 2019by phxAdmin
Blogroll, Live, Market Analysis

This Fluctuating Market, Man! Part 7 of 11

Our Cromford Report Friends also track flips in the market, which is telling us a lot —specifically, they’ve driven prices up so high now that they can’t get their margins and they are getting out.

market

Chickity-check this out. See the first of these two slides. (The next comes in the next post, so check back). They show how the number of flips per month has dropped 30%.

What does that mean? The flippers have realized that they have pushed prices too high and buyers are not giving them the margins they want.

What does this mean for you?

SELLERS: Don’t try to do a flip right now unless you bought really, really, really cheaply!

BUYERS: There are a lot of terribly-done flips out there. But if you are willing to look, you are in a stronger position to make those flippers drop those prices. We are not talking about 10% discounts here. But if you 

Call us directly for more insights at 602-456-9388.

March 5, 2019by phxAdmin
Page 32 of 49« First...102030«31323334»40...Last »

Subscribe to Our Newsletter

We keep your data private and share your data only with third parties that make this service possible. Read our Privacy Policy.

Thank you! Please check your inbox or spam folder to confirm your subscription.

Categories

  • Art
  • Blogroll
  • Design
  • Editor's choice
  • Events General
  • Events GYP
  • Fashion
  • Featured
  • First Time Home Buyer
  • Homes
  • Life
  • Light Rail
  • Live
  • Market Analysis
  • NeighborhoodVideos
  • Phoenix News
  • Photography
  • Photoshootings
  • Profiles
  • Public Policy
  • Renovation
  • Renting
  • Restaurant Reviews
  • Sustainable Living
  • Tips
  • Uncategorized


© 2015 copyright GET YOUR PHX ® // All rights reserved // Privacy Policy