September Market Summary
Thanks, one last time, to our friends at the Cromford Report. Their in-depth analysis over the last 18 years has given me an edge as a realtor. I hope you’ve gained from them as well.
To highlight…
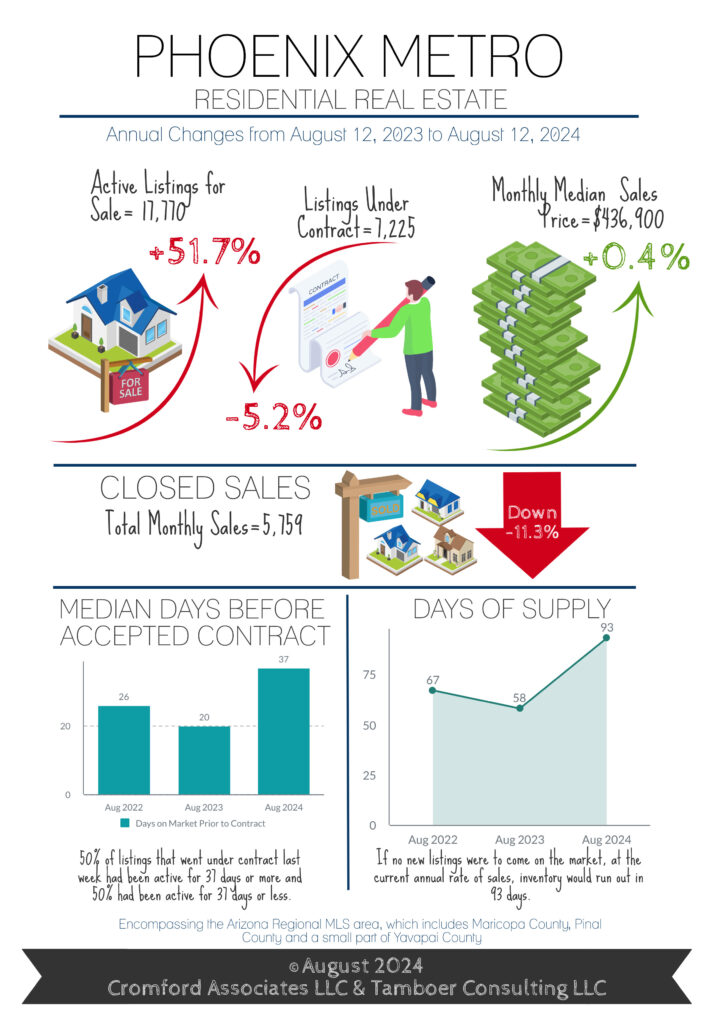
Here are the basics – the ARMLS numbers for September 1, 2024 compared with September 1, 2023 for all areas & types:
- Active Listings (excluding UCB & CCBS): 18,430 versus 11,969 last year – up 54% – and up 5.5% from 17,474 last month
- Active Listings (including UCB & CCBS): 21,047 versus 14,476 last year – up 45% – and up 3.6% compared with 20,320 last month
- Pending Listings: 4,041 versus 4,604 last year – down 12.2% – and down 9.0% from 4,441 last month
- Under Contract Listings (including Pending, CCBS & UCB): 6,658 versus 7,111 last year – down 6.4% – and down 8.6% from 7,287 last month
- Monthly Sales: 5,683 versus 6,267 last year – down 9.3% – and down 8.5% from 6,208 last month
- Monthly Average Sales Price per Sq. Ft.: $290.60 versus $282.14 last year – up 3.0% – and up 1.3% from $286.74 last month
- Monthly Median Sales Price: $440,000 versus $435,000 last year – up 1.1% – but unchanged from $440,000 last month
The re-sale market continues in the doldrums and has reacted very little so far to the lower mortgage rates that have emerged since July. Under contract listings went down a further 8.6% during August rather than staging a recovery. Demand appears to be stronger in the new home sector but that has a relatively modest effect on the MLS statistics because the bulk of new homes are not listed on the MLS. However one look at the stock price charts for the major homebuilders will tell you they are in a good mood.
Re-sale supply usually rises between August and November, but this year the trend got off to an early start and we have 5.5% more listings active and without a contract than a month ago. With demand weak and supply rising, sellers are not getting the break they were probably hoping for. Concession to buyers and price cuts continue to be common and widespread.
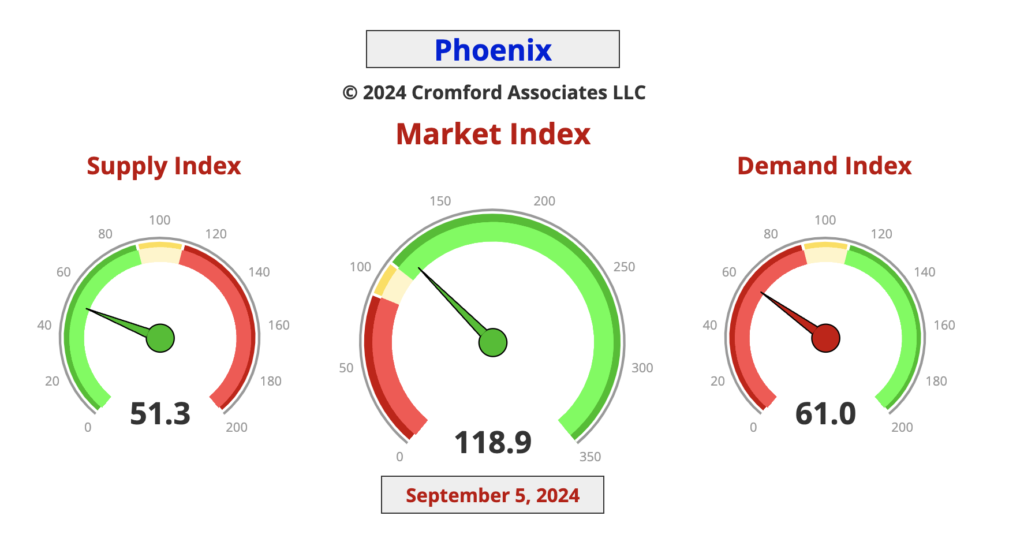
The Cromford® Market Index slipped below 100 at the end of July and spent all of August hovering between 99 and 100. We rarely see such little movement in the CMI. The contract ratio is somewhat less stable, falling from 42 to 36 and this represents a further cooling in the market. It seems many potential buyers want to see rates drop below 6% before they make a move.
The only bright spot for sellers is that pricing improved during August with the average $/SF rising 1.3% from July. However the median sales price was unchanged and is up only 1.1% from a year ago. This is less than inflation so in real terms homes are cheaper than this time last year. This statement does not apply to the very top end of the market which has significantly risen in price over the last 12 months. In fact we saw a new record of almost $32.4 million paid for a new home just completed in Paradise Valley’s Mummy Mountain Estates. Unusually, this was a spec home and it sold for more than $2,000 per sq. ft. The market over $5 million is not seeing the same conditions as the regular market.


