Get Your PHX - A Whole New Way to Experience Phoenix
  • Home
  • Our Blog
  • About Us
  • Contact
Get Your PHX - A Whole New Way to Experience Phoenix
Home
Our Blog
About Us
Contact
  • Home
  • Our Blog
  • About Us
  • Contact
Blogroll

Offsetting My Carbon

I’ve been trying to find a better way to offset my carbon for a few years now. You can see my recent attempt here, and my lessons learned here.

So, that attempt did not turn out so well, but not for lack of trying. I was more annoyed with how the Arbor Day Foundation did (or didn’t) use my contribution.

But, I’m ready to start again. It’s a new day.

And, if you are looking for relatively easy ways to take action on climate change, and also see where your contribution goes, then you might want to try Wren. Read this description or this blog on how it works.

To be fair, I’m just trying it now. So, I’ll report back to you if you don’t feel like being an early adopter on this one.

Parenthetically, I can report positive results from my adoption of Ecosia to direct internet ad revenues to tree planting. It was easy to set up and runs silently in the background as I do my work.

Let’s start at the beginning. Using Wren’s simple-to-use carbon calculator, I found that I use about 18 tons of carbon each year. This was shy of the 20 tons that Arbor Day calculated for me.

In both cases, it seems high to me. I don’t drive as much as average Americans, I limit meat consumption and I have solar panels. But, that’s the point of this exercise. I don’t think many of us realize how much carbon we really contribute to the problem.

Regardless, let’s assume this is off and I only consume 15 tons. That’s still twice the UK average; a place with a standard of living I’d be happy to endure.

This exercise is reinforcing my plans later this year to replace my old A/C & heater unit with a new, high efficient A/C + heat pump, to replace my gas stove with an induction stove and to exchange my old fridge with a new Energy Star refrigerator.

But, in addition to that (and voting for climate-friendly candidates), I can also contribute to carbon offset directly.

The problem I had with Arbor Day was that (1) I did not trust that they spent the money I sent them; (2) I sent them a big check all at once, which hurt; and (2) they sent me tons of paper junk mail made from, you know, trees.

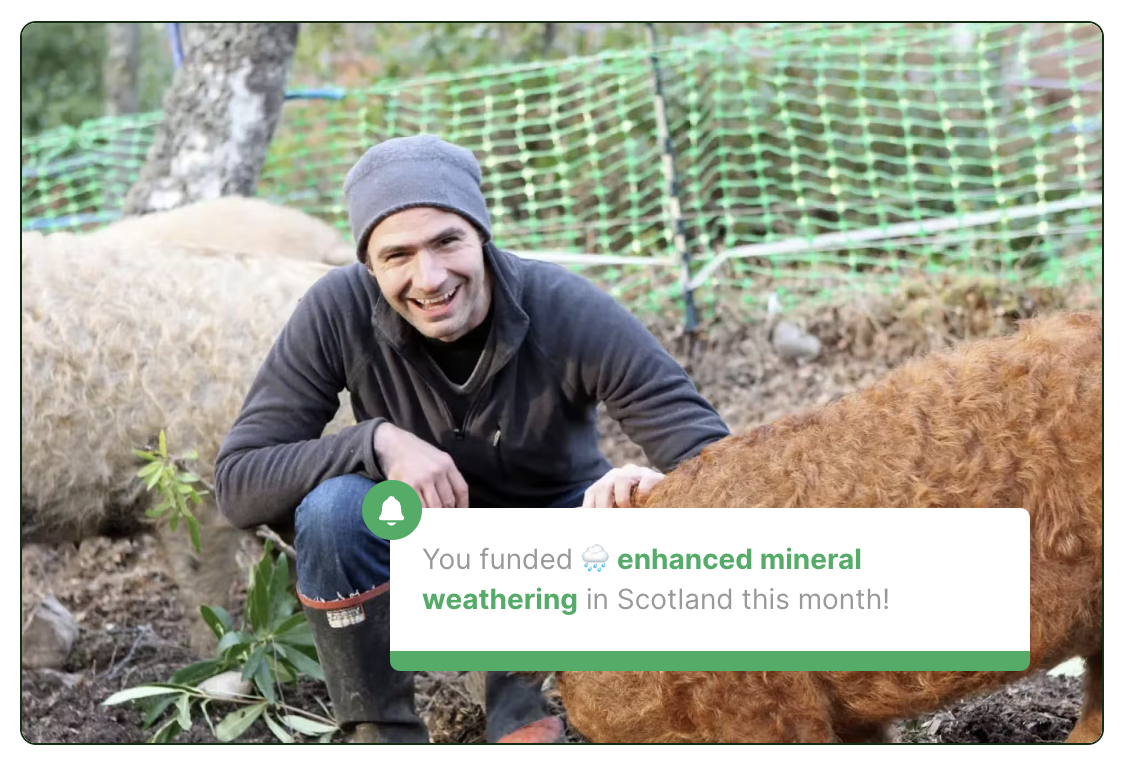
What I like about Wren is that they give me regular updates on the projects they fund with my monthly contribution.

One draw-back: Wren is not a 501c3. It is a Public Benefits Corporation (PBC), if that matters to you. Frankly, as long as I see results, and don’t find that they over-pay their executives, I’m cool with it.

I choose the $38/mo. option, since that seems doable.

So, anyway, if you’d like to try, go through my referral link here. Wren plants 10 native trees for each referral I make.

July 30, 2022by phxAdmin
Blogroll

A Dog’s Other Best Friend

Donna Reiner has written many articles over the years for the Arizona Republic and others about Phoenix history and memorials.  She is a regular contributor to our newsletter. This month, Donna tells us why fire hydrants –something you’d think is about as mundane as buttered white bread– really tell a story about urban growth and how people’s thinking about fire prevention and water use has changed since Phoenix was founded.


Infrastructure is NOT a ho-hum topic. Certainly, it is not a common topic for mealtime discussions, nor probably the old water cooler chats. But imagine, what life would be like if we did not have the infrastructure that we have today?

I recently bumped up against an older form of infrastructure when a septic tank was discovered in my backyard. My subdivision had been platted in 1921 and is located less than a mile north of McDowell Road and Seventh Street, but I couldn’t picture that this area was without sewer hookup at that time (although there was no mention of that in the original ads). And I have no idea if it was ever used. Now it is filled with concrete.

So why is infrastructure so interesting to this historian and other people like me? I’m sure that you can guess that we find the stories associated with it so intriguing. And certainly there are some aha moments.

But now for the story of a dog’s best friend: the ubiquitous fire hydrant! In Phoenix, they are painted a bright yellow and usually found near an intersection. And if you remember the state’s driving codes, you are not supposed to park closer than 15 feet from one. But what is the background on these hydrants?

A laborious search through old newspapers revealed what we might consider to be silly mentions. In 1896, one article cited an order of a fire hydrant for the corner of Fourth and Taylor streets and another indicated a special city council meeting regarding the placement of a hydrant at Van Buren and Third Streets (it was considered urgent business!) And believe it or not, there is still a hydrant on that southeast corner!

The Arizona Republican even posted the expenditures for hydrant rental and repairs. This was important information, but renting hydrants? What was that all about? Further research answered those questions. It seems that the water works system at the time was privately owned and therefore had a contract to furnish a set number of hydrants for a fee, of course. After careful analysis when the contract came up for renewal, the city eventually took over the water system and ended that obligation. Whew….all those behind the scenes discussions which changed the course of our city’s operations.

But imagine, in 1910, every summer night the street department would hose down the dirt streets in the business district using those hydrants in order to keep down the dust! Actually, the department used city jail prisoners to do the hosing all night to complete the task.

But never fear, by 1912, the city was adding hydrants on diagonal corners in the business sector for added protection and also placing hydrants in “remote” residential districts. As the municipal water system expanded and upgraded because Phoenix was growing, more hydrants were added to the system. Interestingly, their placement has for the most part remained constant even with the addition of new hydrants.

If you have a dog, you know how much they love those hydrants. We humans generally take them for granted.

July 30, 2022by phxAdmin
Blogroll

A Balanced Market?!

When I say “a balanced market”, you might think of a tranquil lake with slight ripples splashed with moonlight.

Or, maybe not. I mean, that was really specific

But, what we mean by “balanced market” has more to do with the buyers’ and sellers’ relative advantage.

Where things stand now, the Cromford Index is hovering right around 100 –the point at which neither seller nor buyer have an advantage. If it continues to drop below 100, watch for price reductions in order to sell a home.

In other words, if you are thinking of selling, do so now or wait for another 18 months to a year for the market to recover.

If you are a buyer, you now have so many more options for homes. You are not in a market where you can offer 10% less and the seller will accept your offer with a smile and a home-made banana nut muffin.

But, seriously, have a look at this graphic snapshot of July. The number of active listings is up 159% from this month last year — the majority of this climb in just the last few months.

Here’s what the data nerds over at the Cromford Report have to say about where we are:

For Buyers

“Welcome to a balanced market, how quickly the tables have turned! While seller markets are ideal for the not-so-perfect home, balanced markets are ideal for the not-so-perfect buyer.

This means that buyers who have been recently rejected due to lower down payments, non-conventional financing, or need for closing cost assistance will find sellers are now willing to work with them in this new environment.”

For Sellers

“The proverbial ‘Dump Your Junk’ season is over, that loving phrase the industry uses when demand is significantly higher than supply and even the smelliest dilapidated property gets multiple offers over asking price. That is no longer the case as of this writing. Get ready for longer marketing times, multiple price reductions, Realtor® tours, price opinions, staging, repairs, seller-paid closing costs and price negotiations. The extreme seller market is over.

It’s no surprise that the market has been shifting since February, with the primary influence being large mortgage rate increases. However, over the past 6 weeks mortgage rates have been particularly volatile, fluctuating from 5.1% to 5.8% within 3 weeks only to drop to 5.3% over the next 2 weeks, and then back up to 5.8% a week later. History tells us that buyers do not like sharp, rapid fluctuations in mortgage rates. It causes buying activity to freeze until a level of stability and certainty can be achieved. This market is no different, contract activity has dropped 28% in the last 6 weeks. The number of listings under contract at this time of year should be around 10,000, putting today’s count of 8,680 well below normal.”

July 30, 2022by phxAdmin

Subscribe to Our Newsletter

We keep your data private and share your data only with third parties that make this service possible. Read our Privacy Policy.

Thank you! Please check your inbox or spam folder to confirm your subscription.

Categories

  • Art
  • Blogroll
  • Design
  • Editor's choice
  • Events General
  • Events GYP
  • Fashion
  • Featured
  • First Time Home Buyer
  • Homes
  • Life
  • Light Rail
  • Live
  • Market Analysis
  • NeighborhoodVideos
  • Phoenix News
  • Photography
  • Photoshootings
  • Profiles
  • Public Policy
  • Renovation
  • Renting
  • Restaurant Reviews
  • Sustainable Living
  • Tips
  • Uncategorized


© 2015 copyright GET YOUR PHX ® // All rights reserved // Privacy Policy