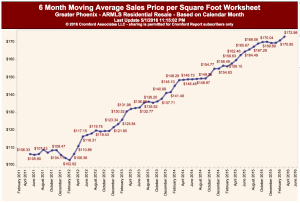
Our friends at the Cromford Report supply us with great data for our May Market Update, which we use to help our clients. Here’s a summary of the data as of the middle of April, in time for this month’s Clark Report.
For the monthly period ending April 15, we are currently recording a sales $/SF of $140.06 averaged for all areas and types across the ARMLS database. This is virtually unchanged (up just 7c) from the $139.99 we now measure for March 15.
Sales pricing over the last 31 days has been considerably weaker than expected but stayed within the lower bound of our 90% confidence range.
In most years, prices make strong progress between March and June so we felt confident that last month’s forecast was reasonable. Only adding 7c to the average price per sq. ft. between March 15 and April 15 is pretty underwhelming. We are forecasting a more impressive advance for May 15, but we could again be confounded by a negative change in the sales mix.
Normally prices decline between June and September each year, so sellers will be hoping for a stronger pricing trend during the next 2 months than we saw during the last 2 months.
This is reflected in the CenPho and historic markets, although the data seems to contradict itself. In short, while the sales prices seem to be going up, the average days on market are increasing and the active listing count seems to be going up.
What does this tell us?


