 I had the pleasure this month of doing a presentation to a One Community business lunch group with the esteemed Tina Tamboer of the Cromford Report.
We were exploring the larger questions of why people perceive changes in the market as they do, as well as noting the market shift we are under-going right now.
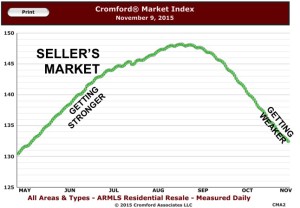
For instance, there is always a lag between when the Cromford Index starts to see a shift between seller’s and buyer’s market conditions and when the market actually changes. This is as close to a crystal ball as I’ve ever seen.
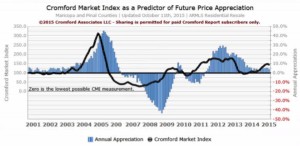
The chart to the right is a little hard to see because I grabbed it from Tina’s powerpoint presentation. But, generally, you can see that the shift in the Cromford Index almost always precedes shifts in the market.
 Paradoxically, you CAN see the market index dropping while prices are still increasing. But once sellers see fewer and fewer buyers, or stay on the market longer, prices begin to drop.
That is what we are seeing right now. We see the Index shifting back toward a balanced market, or maybe even a buyer’s market. Tina figures that this trend will persist over the next few months.
That is why this month’s update from Cromford seems odd at first, but makes sense when you learn more about how the Cromford Index works.
“Our mid-point forecast for the average monthly sales $/SF on November 15 is $135.55, which is 0.3% lower than the November 15 reading. We have a 90% confidence that it will fall within ± 2% of this mid point, i.e. in the range $132.84 to $138.26.”
What they are saying is that the prices are staying pretty close to the same as last month, even going up a small amount. But, in the next few months, they will likely chase the Cromford Index downward.
What does this mean? It means if you are a seller right now, price aggressively. Don’t think that because your buddy Frank sold his house 3 months ago for a huge profit that the market is in that same place. If he sold it three months ago, then he probably priced it based on comparable properties that sold six months ago. Thats, like, a different epoch altogether!
So, sellers, either be competitive and get ahead of this line or find yourself chasing it downward after being on the market for a while. Buyers, this is not a market where you can offer 10% less than asking and get it. But the advantage is trending your way.

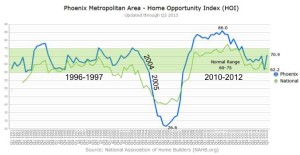
Over-all, too, our market still remains generally affordable, despite price increases since 2014. This chart says that right now a family making the median household income can afford 70.9 percent of all houses on the market. Not bad.
We do, however, need homes for first time home buyers and moderate-income buyers, especially in the CenPho market. I hear there are some developments on the way on that. More later.
If you need advice on how to buy or sell, let’s consult the market data tea leaves together. Call me at 602-456-9388.


