Get Your PHX - A Whole New Way to Experience Phoenix
  • Home
  • Our Blog
  • About Us
  • Contact
Get Your PHX - A Whole New Way to Experience Phoenix
Home
Our Blog
About Us
Contact
  • Home
  • Our Blog
  • About Us
  • Contact
Live, Market Analysis

June 2015 Market Update

Here are some take-aways as we enter the June market, from our friends at the Cromford Report:

1) May continued to be a good time to be a seller in most areas & price ranges.

2) Demand quickly recovered from well below normal in January to slightly above normal by mid April and it has stayed there throughout May.

Front2_1308_E_Georgia_SALE_02

3) Meanwhile supply continues to drop for an ever-widening collection of areas & price ranges, giving plenty of problems for most buyers who are bumping into each other at the few listings that remain. Multiple offer situations are increasing.

4) If buyers are wanting to spend more than $500,000 then they are in luck – supply is much more plentiful above that mark, though a few very popular areas like Arcadia have relatively slim pickings.  During May even those upper price ranges saw a downward trend in active listing counts, but not enough to cause any real problems for most buyers.

5) If today’s normal demand can cause supply to drop as much as it did in the last month, then buyers are going to have an even harder time if demand were to grow.

6) This market is particularly brutal for the entry level market, which is desperately short of homes for sale or rent.

More points:
Active Listings: 20,351 versus 25,555 last year – down 20.4% – and down 5.4% from 21,512 last month.

Pending Listings: 7,819 versus 6,965 last year – up 12.3% – but down 1.7% from 7,951 last month.

Under Contract Listings: 12,063 versus 10,360 last year – up 16.4% – but down 1.7% from 12,276 last month.

Monthly Sales: 8,293 versus 7,509 last year – up 10.4% – but down 2.3% from 8,490 last month.

Monthly Average Sales Price per Sq. Ft.: $136.19 versus $127.65 last year – up 6.7% – and up 0.5% from $135.45 last month.

Monthly Median Sales Price: $211,000 versus $192,500 last year – up 9.6% – and up 4.5% from $202,000 last month

This increase in sales prices over last year is more acute in historic areas from what I’ve seen anecdotally.

The Cromford Index seems to be flattening out a little bit, as I would expect in the summer. This means the degree to which it is a seller’s market is just not increasing as quickly as it was in April. It is still a solid seller’s market.
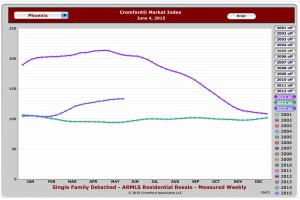
Cromford Index 2015-06-09

June 9, 2015by phxAdmin
First Time Home Buyer, Live, Market Analysis

More on Not Trusting Zillow

wizard pst

I was driving down the road yesterday, minding my own business, when another ad for Zillow came on the radio.

They claimed that their service helps you compare prices, find rentals and maybe even train your cat to dance the polka. I might be wrong on that last point, but it sounded like he was saying that.

But, it brought me all back to the various reasons why Zillow is not necessarily your friend when it comes to buying or selling a home.

Here, here, here and here are four posts that I’ve done since 2011 which give you good details on what is wrong with this and other services like them. After hearing these ads, I feel obliged to educate the world.

1) Zillow and other services make money by selling ad space to realtors, to show up just at that moment you are looking at a nice home on their website. The agents who purchase your data may not be specialists in your area or the type of home you want. This is particularly important in historic areas.

2) The data that these services use comes from the data that we agents update every day, but these services don’t get all of that data. We reserve the most important (and most private) for our professional industry and for our clients. So, you may log on to these services, give them your data to use, but you won’t necessarily get the most up-to-date information.

3) There is a time delay from when we agents update listings (active, pending, closed) and when the services see the change. So, if you need to react quickly to the market, you may not be able to.

4) The data also impacts the estimates that you get from these sites. These services don’t get the most accurate data, so they have to construct some other estimate using older information, extrapolations and duct tape. They often give you an inaccurate picture of your home value, or the home you are looking at. This is especially true with historic homes.

If you want accurate statistical market analysis, specialty in the market and personalized representation, just call and agent so that you can use his or her MLS portal.

I can help you, so call me at 602-456-9388.


June 9, 2015by phxAdmin

Subscribe to Our Newsletter

We keep your data private and share your data only with third parties that make this service possible. Read our Privacy Policy.

Thank you! Please check your inbox or spam folder to confirm your subscription.

Categories

  • Art
  • Blogroll
  • Design
  • Editor's choice
  • Events General
  • Events GYP
  • Fashion
  • Featured
  • First Time Home Buyer
  • Homes
  • Life
  • Light Rail
  • Live
  • Market Analysis
  • NeighborhoodVideos
  • Phoenix News
  • Photography
  • Photoshootings
  • Profiles
  • Public Policy
  • Renovation
  • Renting
  • Restaurant Reviews
  • Sustainable Living
  • Tips
  • Uncategorized


© 2015 copyright GET YOUR PHX ® // All rights reserved // Privacy Policy