
The Cromford Report tracks single family rents. Note, however that not all rentals are on the MLS. Lower priced rentals tend to go to Craigslist, etc.
The “Affordability/Rent” slide shows you how the average lease prices have really gone up recently —more so in CenPho and the historic neighborhoods.
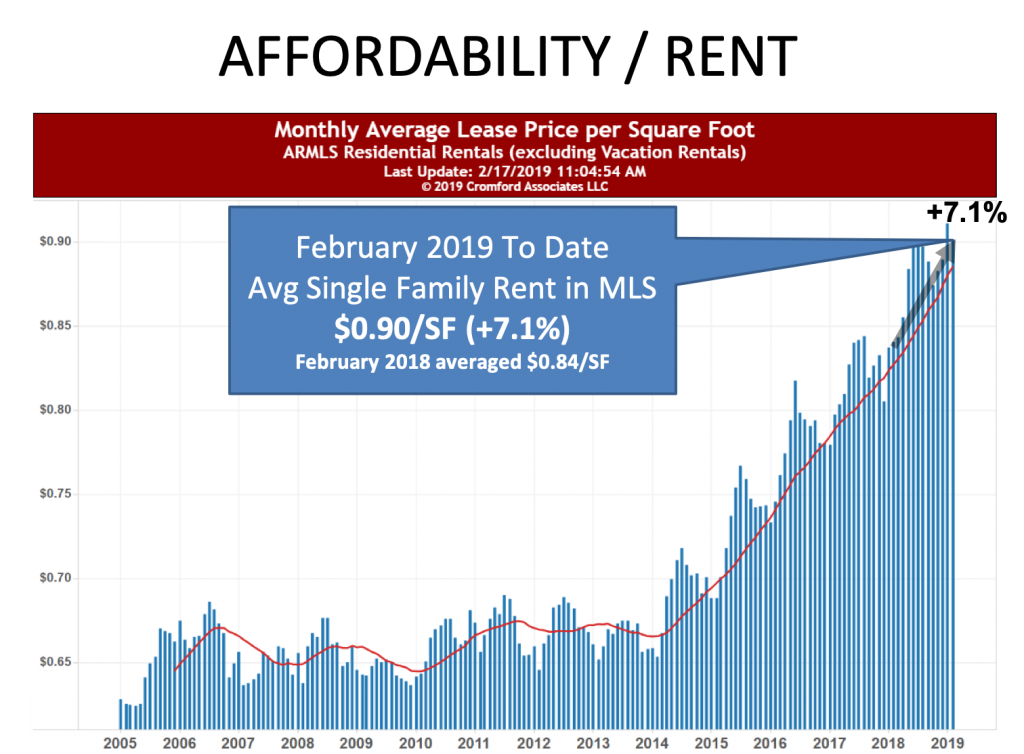
This chart looks really dramatic, but notice that we are going from 65 cents per square foot to 90 cents per square foot over the course of five years. Not that this is nothing.
See our video on the causes of homelessness increases here https://youtu.be/OsdUlEZ1qSI
However, any time I see a chart that looks this dramatic, I like to draw attention to the numbers, not just the graphics.
So, what does this mean for you?
BUYERS: If you are not ready to buy, don’t despair. Save your money as aggressively as possible. Also, the lenders we work with have access to down payment programs for low income buyers. See if you qualify.
SELLERS: Even according to these charts, your home may be less expensive than renting. We can communicate to those renters that buying is an option. Also, from now until early June is the high season. Sell now if you are going to sell this year!
Call us directly for more insights at 602-456-9388.


