
September developed a bit of a cooling trend, as compared to earlier in the year with a very strong seller’s market. Supply has started to grow and demand weakened slightly again. This is not really a major market development like we saw around this time two years ago, but it might be considered mildly disappointing for those rooting for the market to go from strength to strength.
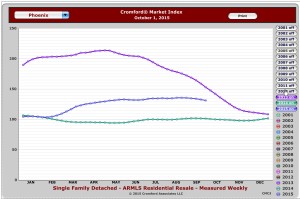
It remains a seller’s market overall. The Cromford® Market Index moved from around the 148 mark at the beginning of August to around the 144 mark at the beginning of October, reversing the gains in August. This is not enough change for my friends at the Index to predict a major change. But it is fair to say that market balance moved to give seller’s slightly less of an advantage in most areas.
Here are the basic ARMLS numbers for October 1, 2015 relative to October 1, 2014 for all areas & types:
• Active Listings (excluding UCB): 20,024 versus 23,514 last year – down 14.8% – but up 4.8% from 19,101 last month
• Active Listings (including UCB): 23,238 versus 26,336 last year – down 11.8% – but up 3.7% compared with 22,413 last month
• Pending Listings: 5,789 versus 5,481 last year – up 5.6% – but down 7.5% from 6,259 last month
• Under Contract Listings (including Pending & UCB): 9,003 versus 8,303 last year – up 8.4% – but down 5.9% from 9,571 last month
• Monthly Sales: 6,966 versus 6,230 last year – up 11.8% – but down 0.9% from 7,100 last month
• Monthly Average Sales Price per Sq. Ft.: $133.24 versus $126.82 last year – up 5.1% – but up 0.7% from $132.26 last month
• Monthly Median Sales Price: $211,000 versus $195,000 last year – up 8.2% – but up 1.4% from $208,000 last month
–Source. Cromfordreport.com


