Its that time of month when we remember to check our fire alarm batteries, we clean out the gutters after all the rain and, oh yeah, we check in with our friends at the Cromford Report.
Around mid-month, they saw a sales $/SF of $147.97 averaged for all areas and types across the ARMLS database. This is up a very strong 2.0% from the $145.07 we now measure for January 15.
 They caution, however, “This may sound like a big difference but the monthly average $/SF can change quite a bit over a short period. For example between January 16 and January 21 it rose from $144.88 to $147.00, a change of 1.5% in just 6 days.”
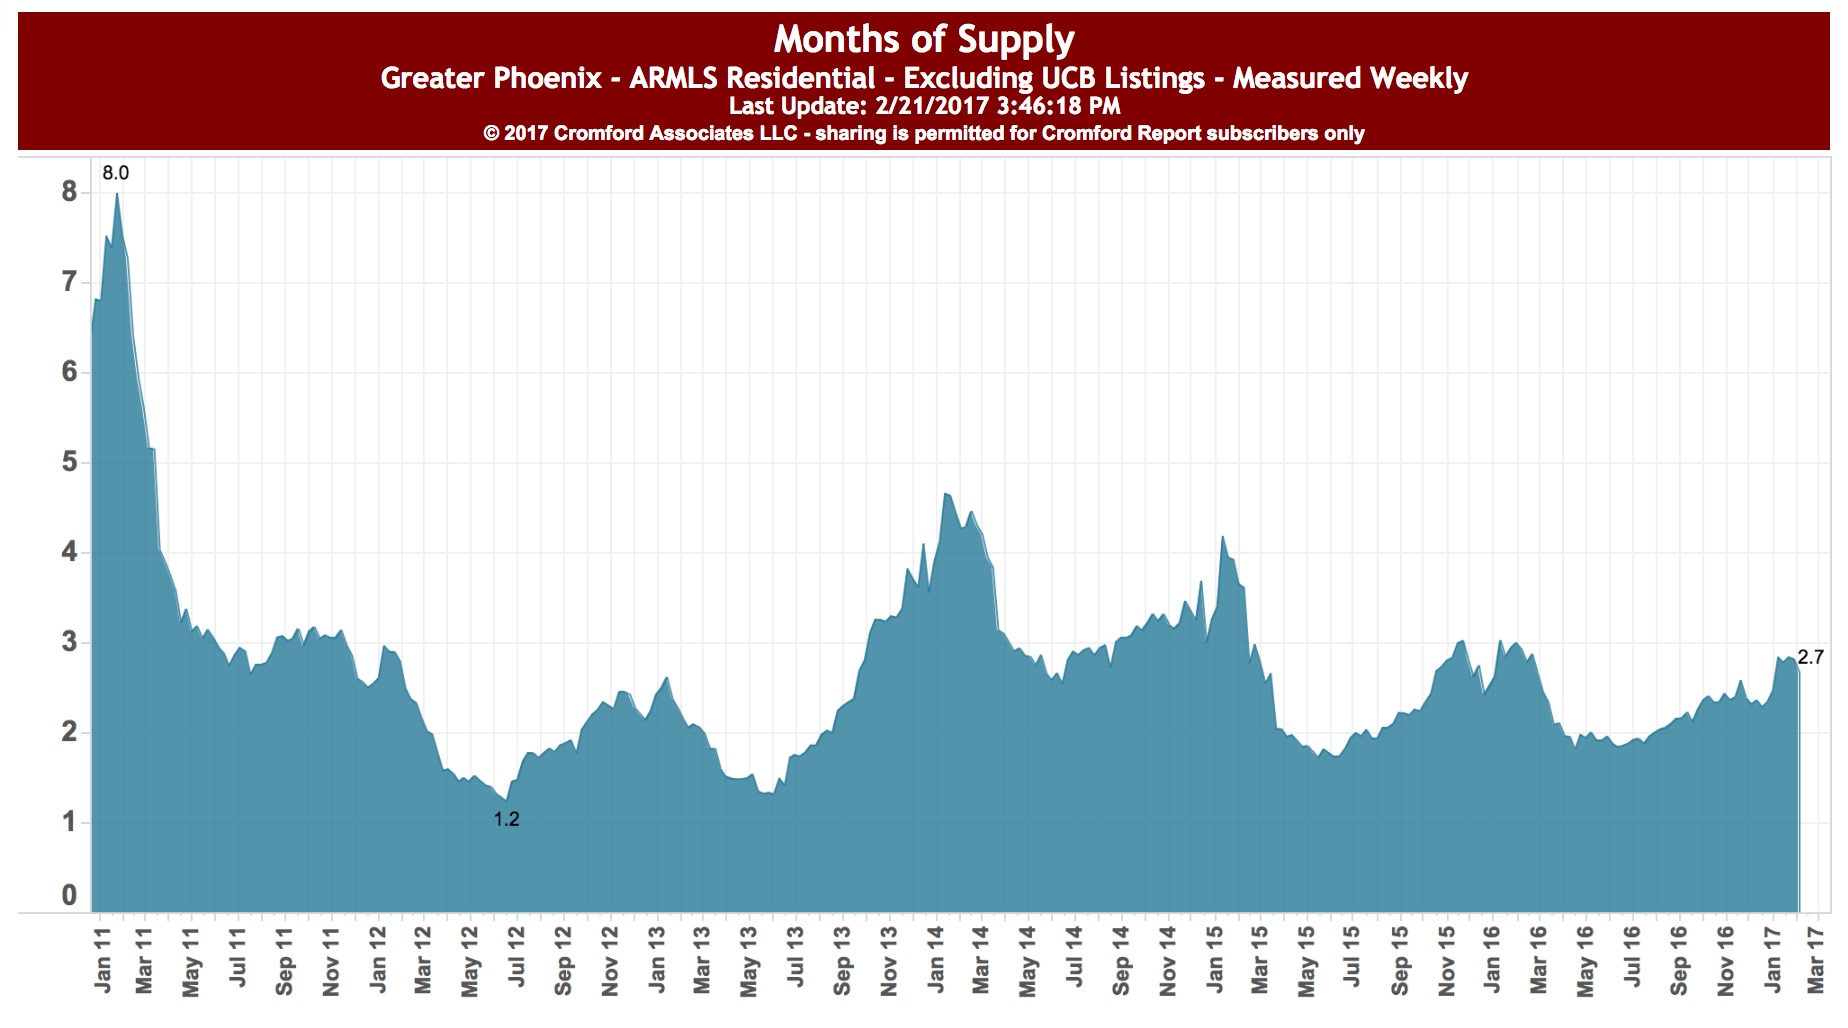
This seems to track (in the very short term, at least) with a small down-tick in “month’s supply of homes.” In other words, if no more homes came on the market today, how many months would it take us to exhaust the inventory? Supply goes down, prices go up.
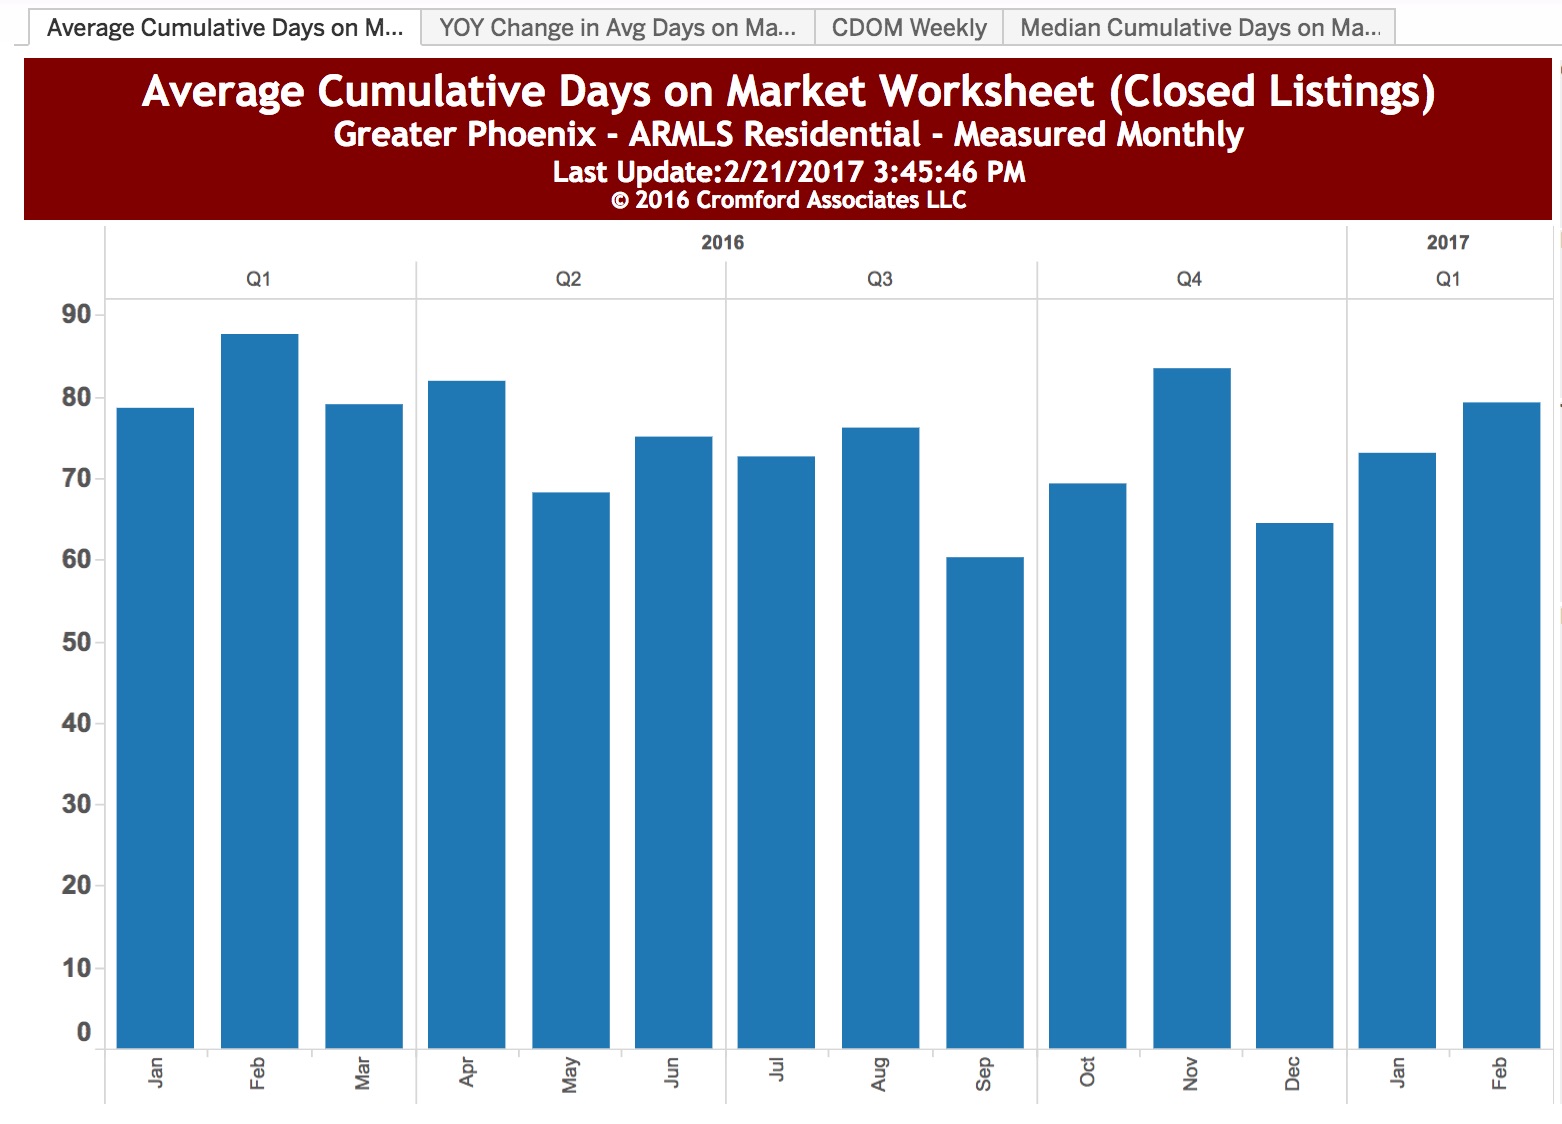 In the CenPho market, we are seeing a small up-tick in days-on-market. I think this is probably still reflects those folks who listed around the holidays and just accumulated days-on-market, while everybody else ate Thanksgiving dinner and celebrated the New Year, nary a thought of buying a home.
Anecdotally, we are still seeing strong interest from people who want to sell their homes and we are constantly getting calls from new buyers. Over-all right about where we would expect to be this time of year.
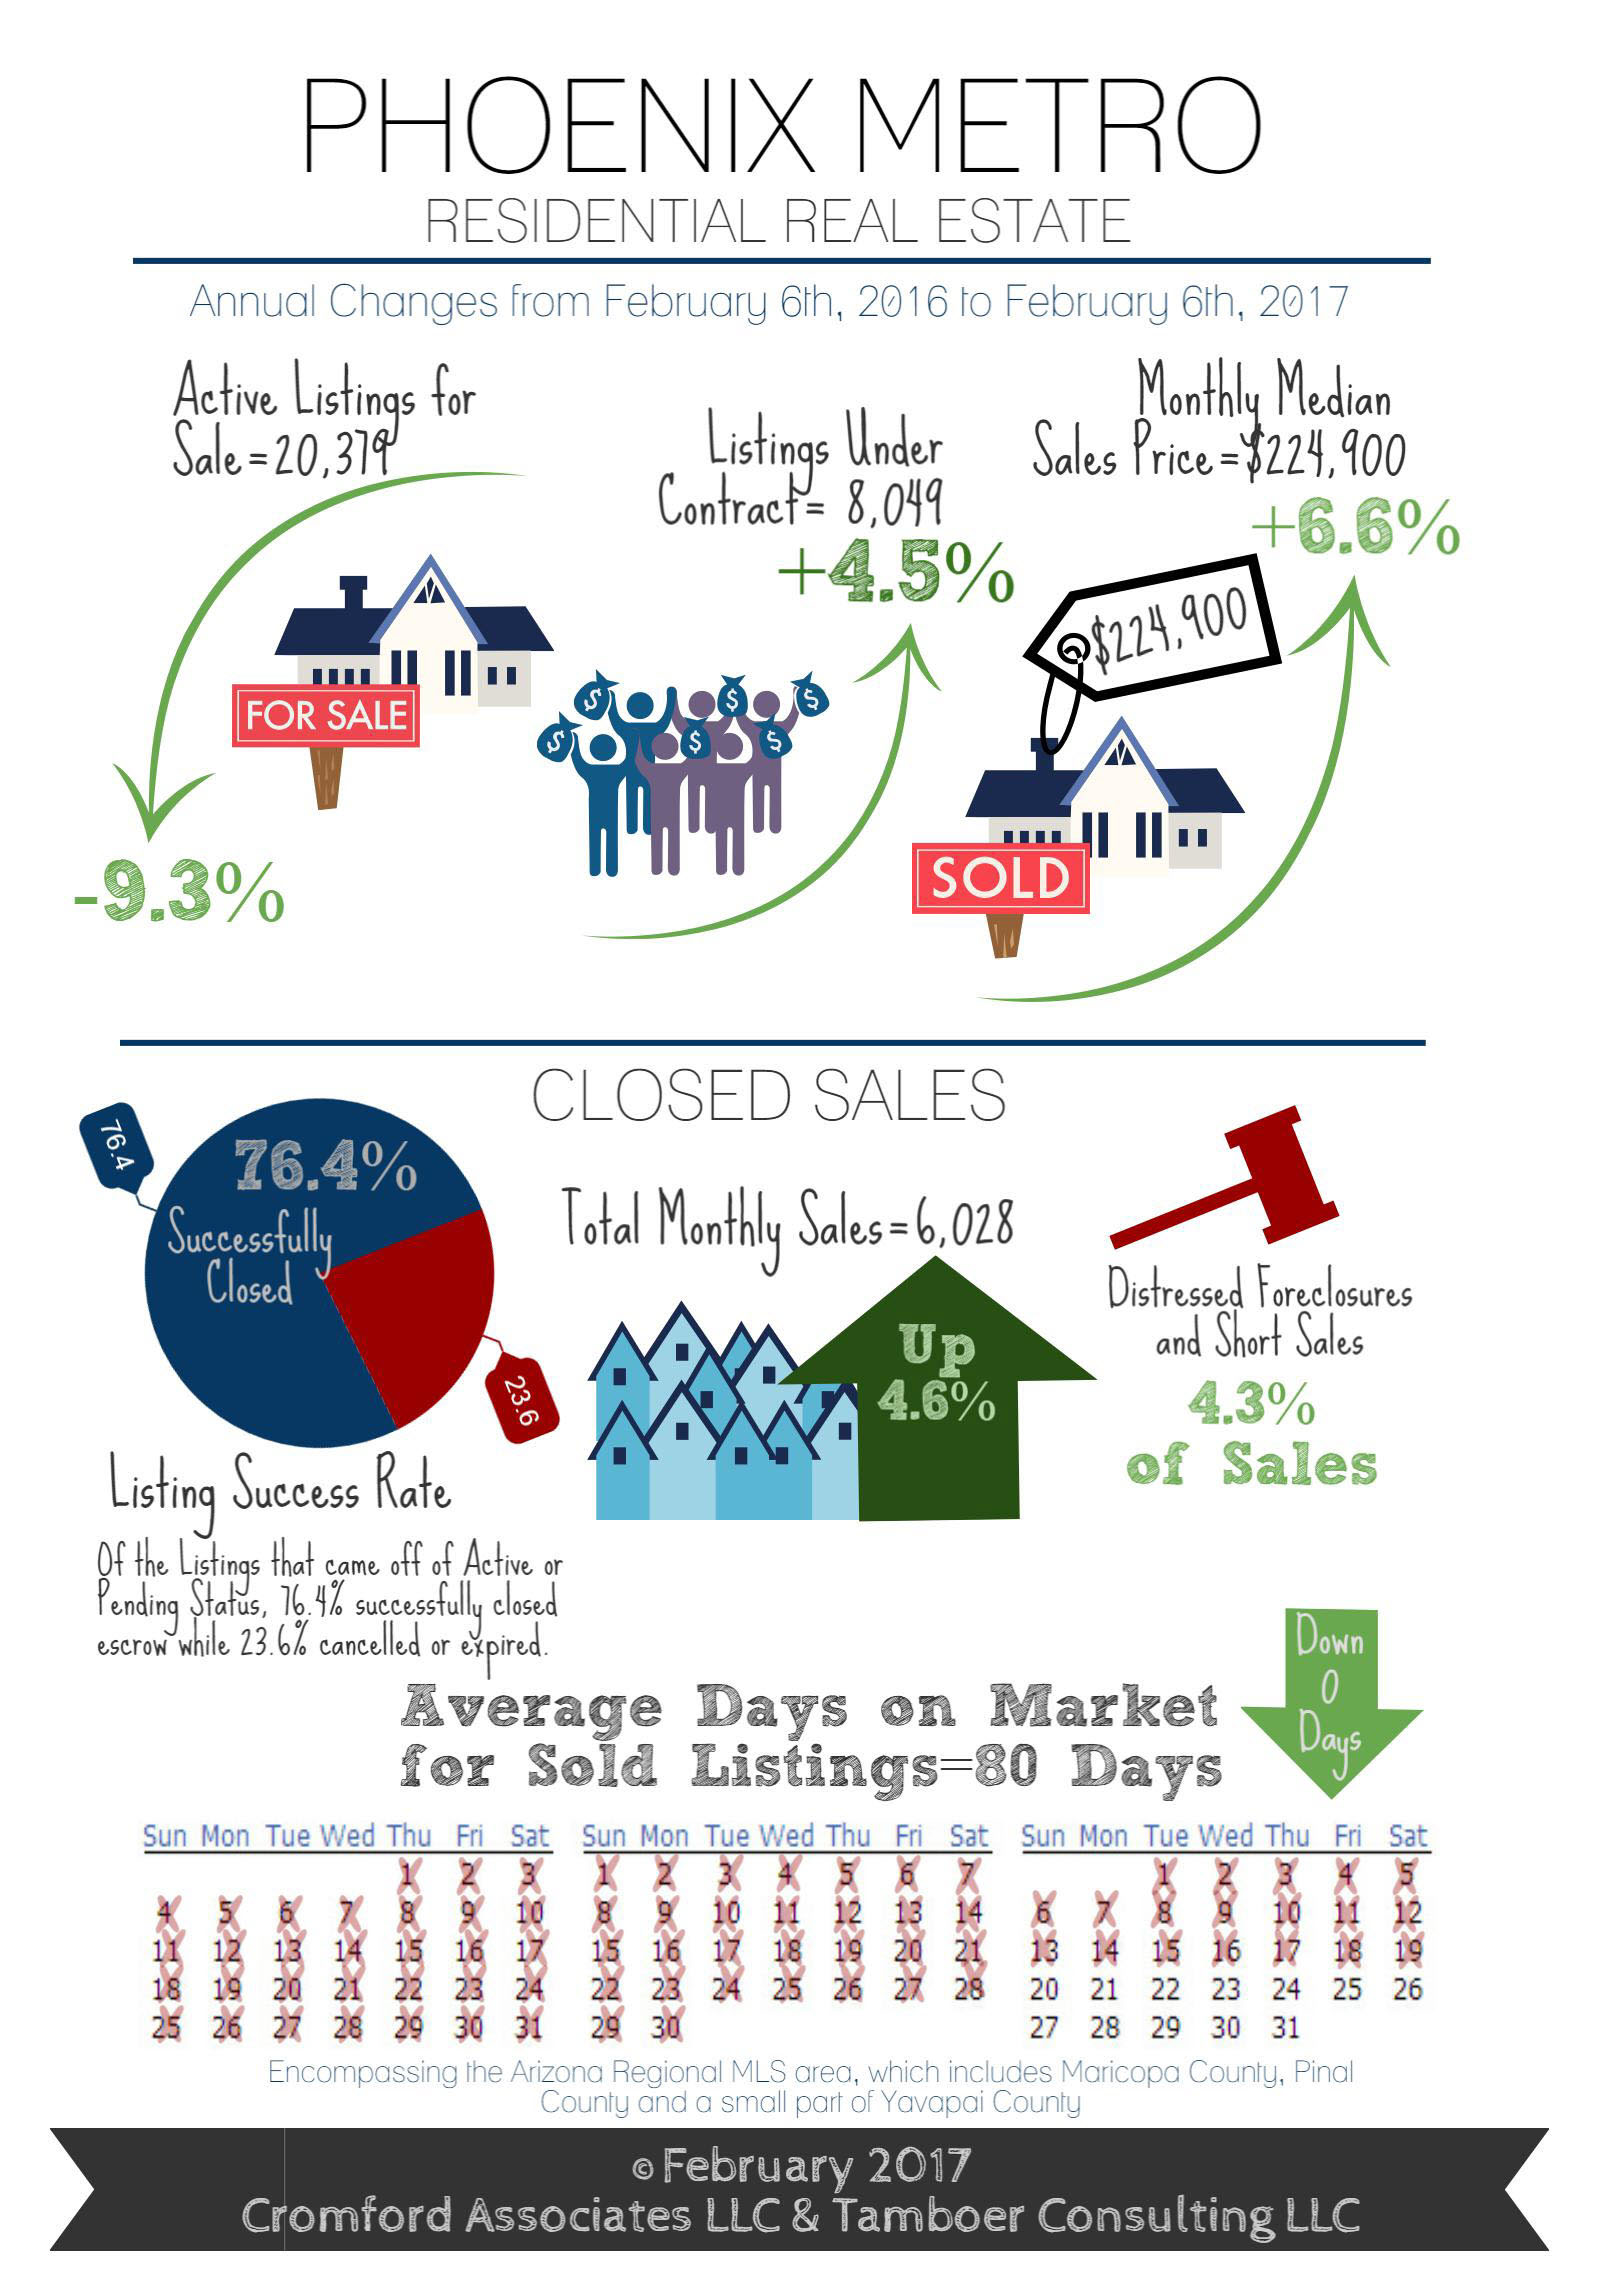
See below for the monthly info-graphic from the Cromford Report Folks.
If you are looking for more statistical information for your home sale or purchase, hit us up at 602-456-9388.