
I’m at odds with my friends at the Cromford Report in this March 2018 Market Update.
I wish I weren’t.
They are seeing a continued upward trend in prices, although slight.
I’m seeing the beginnings of a shift.
First, their comments:
 “For the monthly period ending February 15, we are currently recording a sales $/SF of $159.13 averaged for all areas and types across the ARMLS database. This is up 1.0% or $1.53 from the $157.60 we now measure for January 15. Our forecast range midpoint was $159.14, with a 90% confidence range of $155.95 to $162.31. The actual result was just 1 cent below the mid-point, which means the forecast we gave last month was our most accurate ever.
We are therefore predicting a similar rise over the next 28 days to the one we just experienced between January and February. So far in 2018, with a month and a half of new listings to go on, we have seen a 1.5% decline in new supply over the same period in 2017. Obviously this not going to rebalance the market in favor of buyers. Prices will continue to trend higher until we see either far more supply or much lower demand.”
Second, what Michelle and I are seeing:
In speaking with other agents and in our recent experience, we are seeing less activity above $300,000. Below $200,000 is as hot as ever.
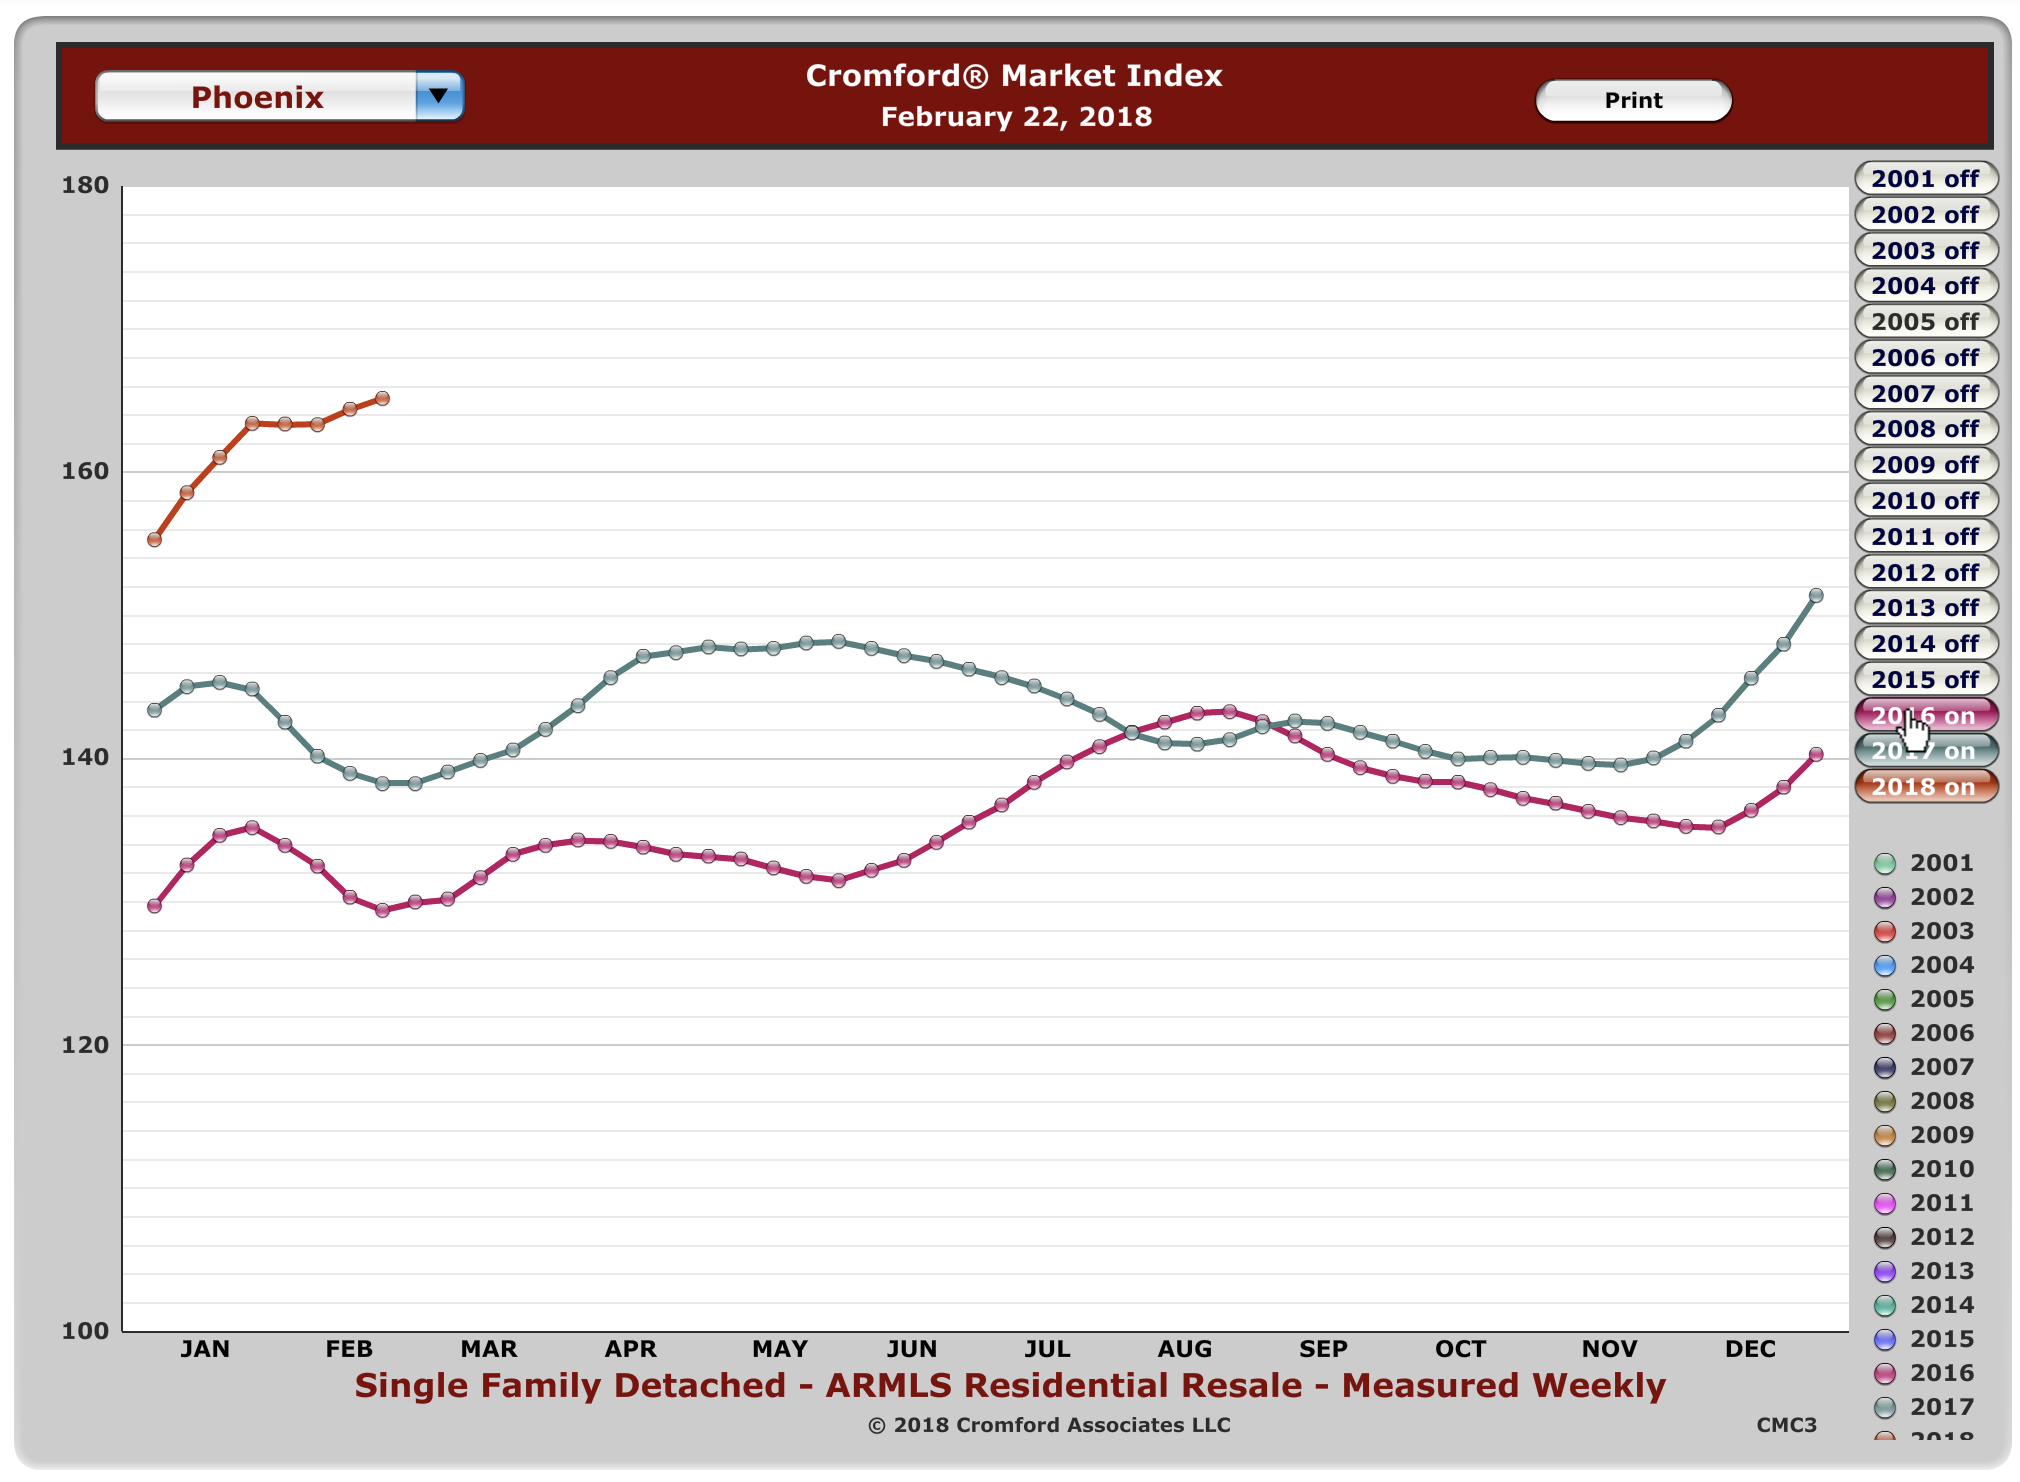
The Cromford Index shows a continued upward climb. There was a bit of a dip a month ago, which I reported. But it is turning around.
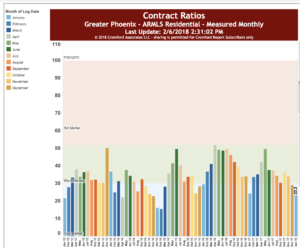
However, we are seeing a slightly lower contract ratio. “The contract ratio indicates how “hot” a market is. It specifically measures the number of completed sales contracts relative to the supply of active listings. The higher the number the greater the buying activity relative to supply. If this number rises then it is a sign of growing contract activity and a positive signal for sellers.
Conversely a falling number is a sign of a weakening market – either supply of active listings is increasing or contract activity is slowing, or both. In a balanced market for normal market segments, the value of the Contract Ratio is usually between 30 and 60.”
Call me paranoid, but I think we are due for some sort of a correction. The only caveat is that this may be less pronounced in a dense urban area, such as right downtown.
Here’s where I could be wrong: the contract ratio often pushed back upward in February and March. I say, if we don’t see that happen when we get the numbers this month it may be a sign.
If you are thinking of selling, let’s get it done right away and let’s be ready to price aggressively.
Call us at 602-456-9388 and we can help you navigate the market.


