 In this month’s market update, it certainly feels like some changes are coming, but it may be too soon to tell what they will be.
Our friends at the Cromford Report are seeing some tightening in supply, and thus increased prices.
“We can see that the supply of active listings without a contract dropped again during the month of May but the deficit compared with 2017 narrowed slightly to 13.3%. May was a weaker month for new listings, down about 1% compared to last year. This was a contrast to April which had seen a stronger rate than 2017. We normally see total supply drop between May and June and we still expect this downward trend to continue until September.
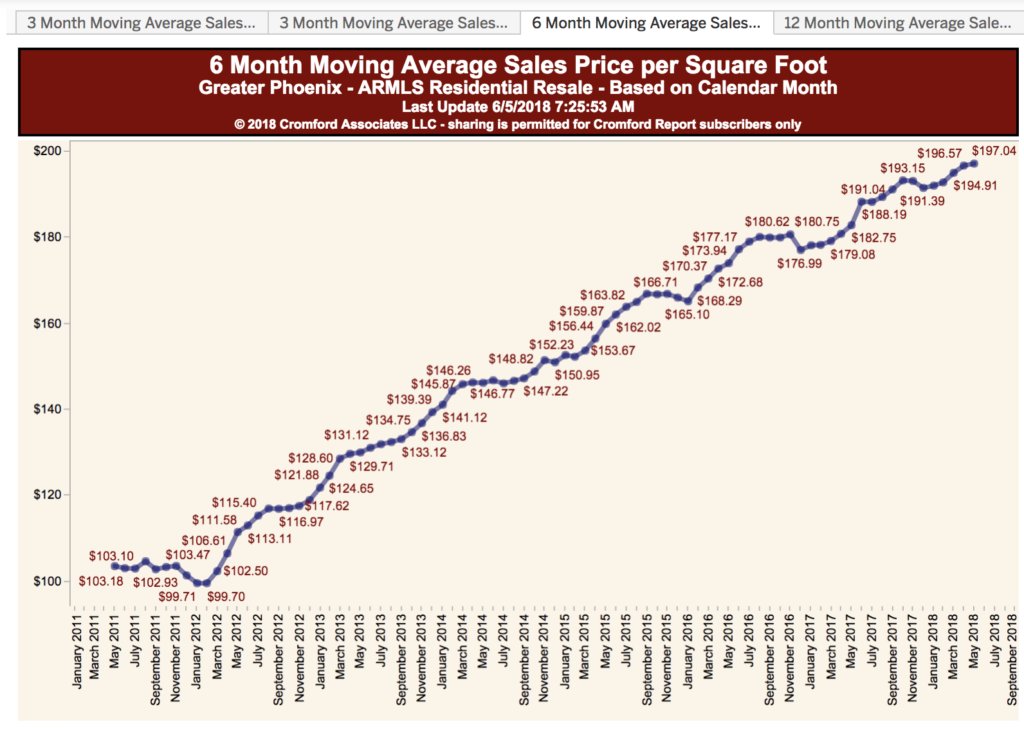
The sales count for May was very strong, topping 10,000 for the first time since 2011. However the number of listings under contract at the beginning of June is much lower than last year – down 6%. Even with this possible sign of wavering demand, supply is so weak that sellers still have a huge advantage in negotiations. This situation inevitably leads to price increases and the annual rate of change has reached 9% for average $/SF and 9.5% for median sales price. This growth is about 4 times the inflation rate and with interest rates rising, homes are obviously getting less affordable. At some point this trend will impact demand, which is why we are keeping a close watch on the annual sales rate and the number of listings under contract.
The rise in interest rates does not just tend to lower demand, in the current circumstances it can lower supply too. Home owners with an existing mortgage will be less inclined to move if their next mortgage is going to be at a much higher rate than their existing one. This is more likely to be the case with every passing month. As a result we do not see prices as likely to fall because of interest rate rises, but we do anticipate limited growth in sales volumes.
It is important to compare sales numbers year over year, but we should also point out that the presence of iBuyers means that there are more transactions than there would be without them. In situations where a seller accepts an iBuyer offer, the home is resold again in a matter of months, so we see 2 transactions instead of 1. The first sale is not shown within the MLS numbers but the second almost always is. Both sales appear in the counts when we look at recorded deeds. With iBuyers representing 4% of the re-sale market, counts of recorded sales are about 2% higher than they otherwise would be.
We started referring to the chronic low inventory over 5 years ago and it is now at the lowest level we have seen during those 5 years. Fluctuations in demand are unlikely to have much impact on the market until we see an increasing trend in listing counts. This was the first sign of a slowdown in April 2005 and will be the first sign of a slowdown if and when we get one in the future. It came suddenly and unexpectedly in April 2005 and it may do the same at any time. However, nobody paid any attention in 2005 and I am assuming we are all older and wiser now. Any unusual activity in the listing counts will show up in the daily Tableau charts which we create and study each and every day.”


