
 The August Market Update shows a continued strong summer. Buyers are having a hard time below $200,000, unless you are looking at condos. Sellers are seeing a continued steady upward climb.
See below for greater details.
This trend is intensified in downtown, as we see more people wanting to live in dense areas.
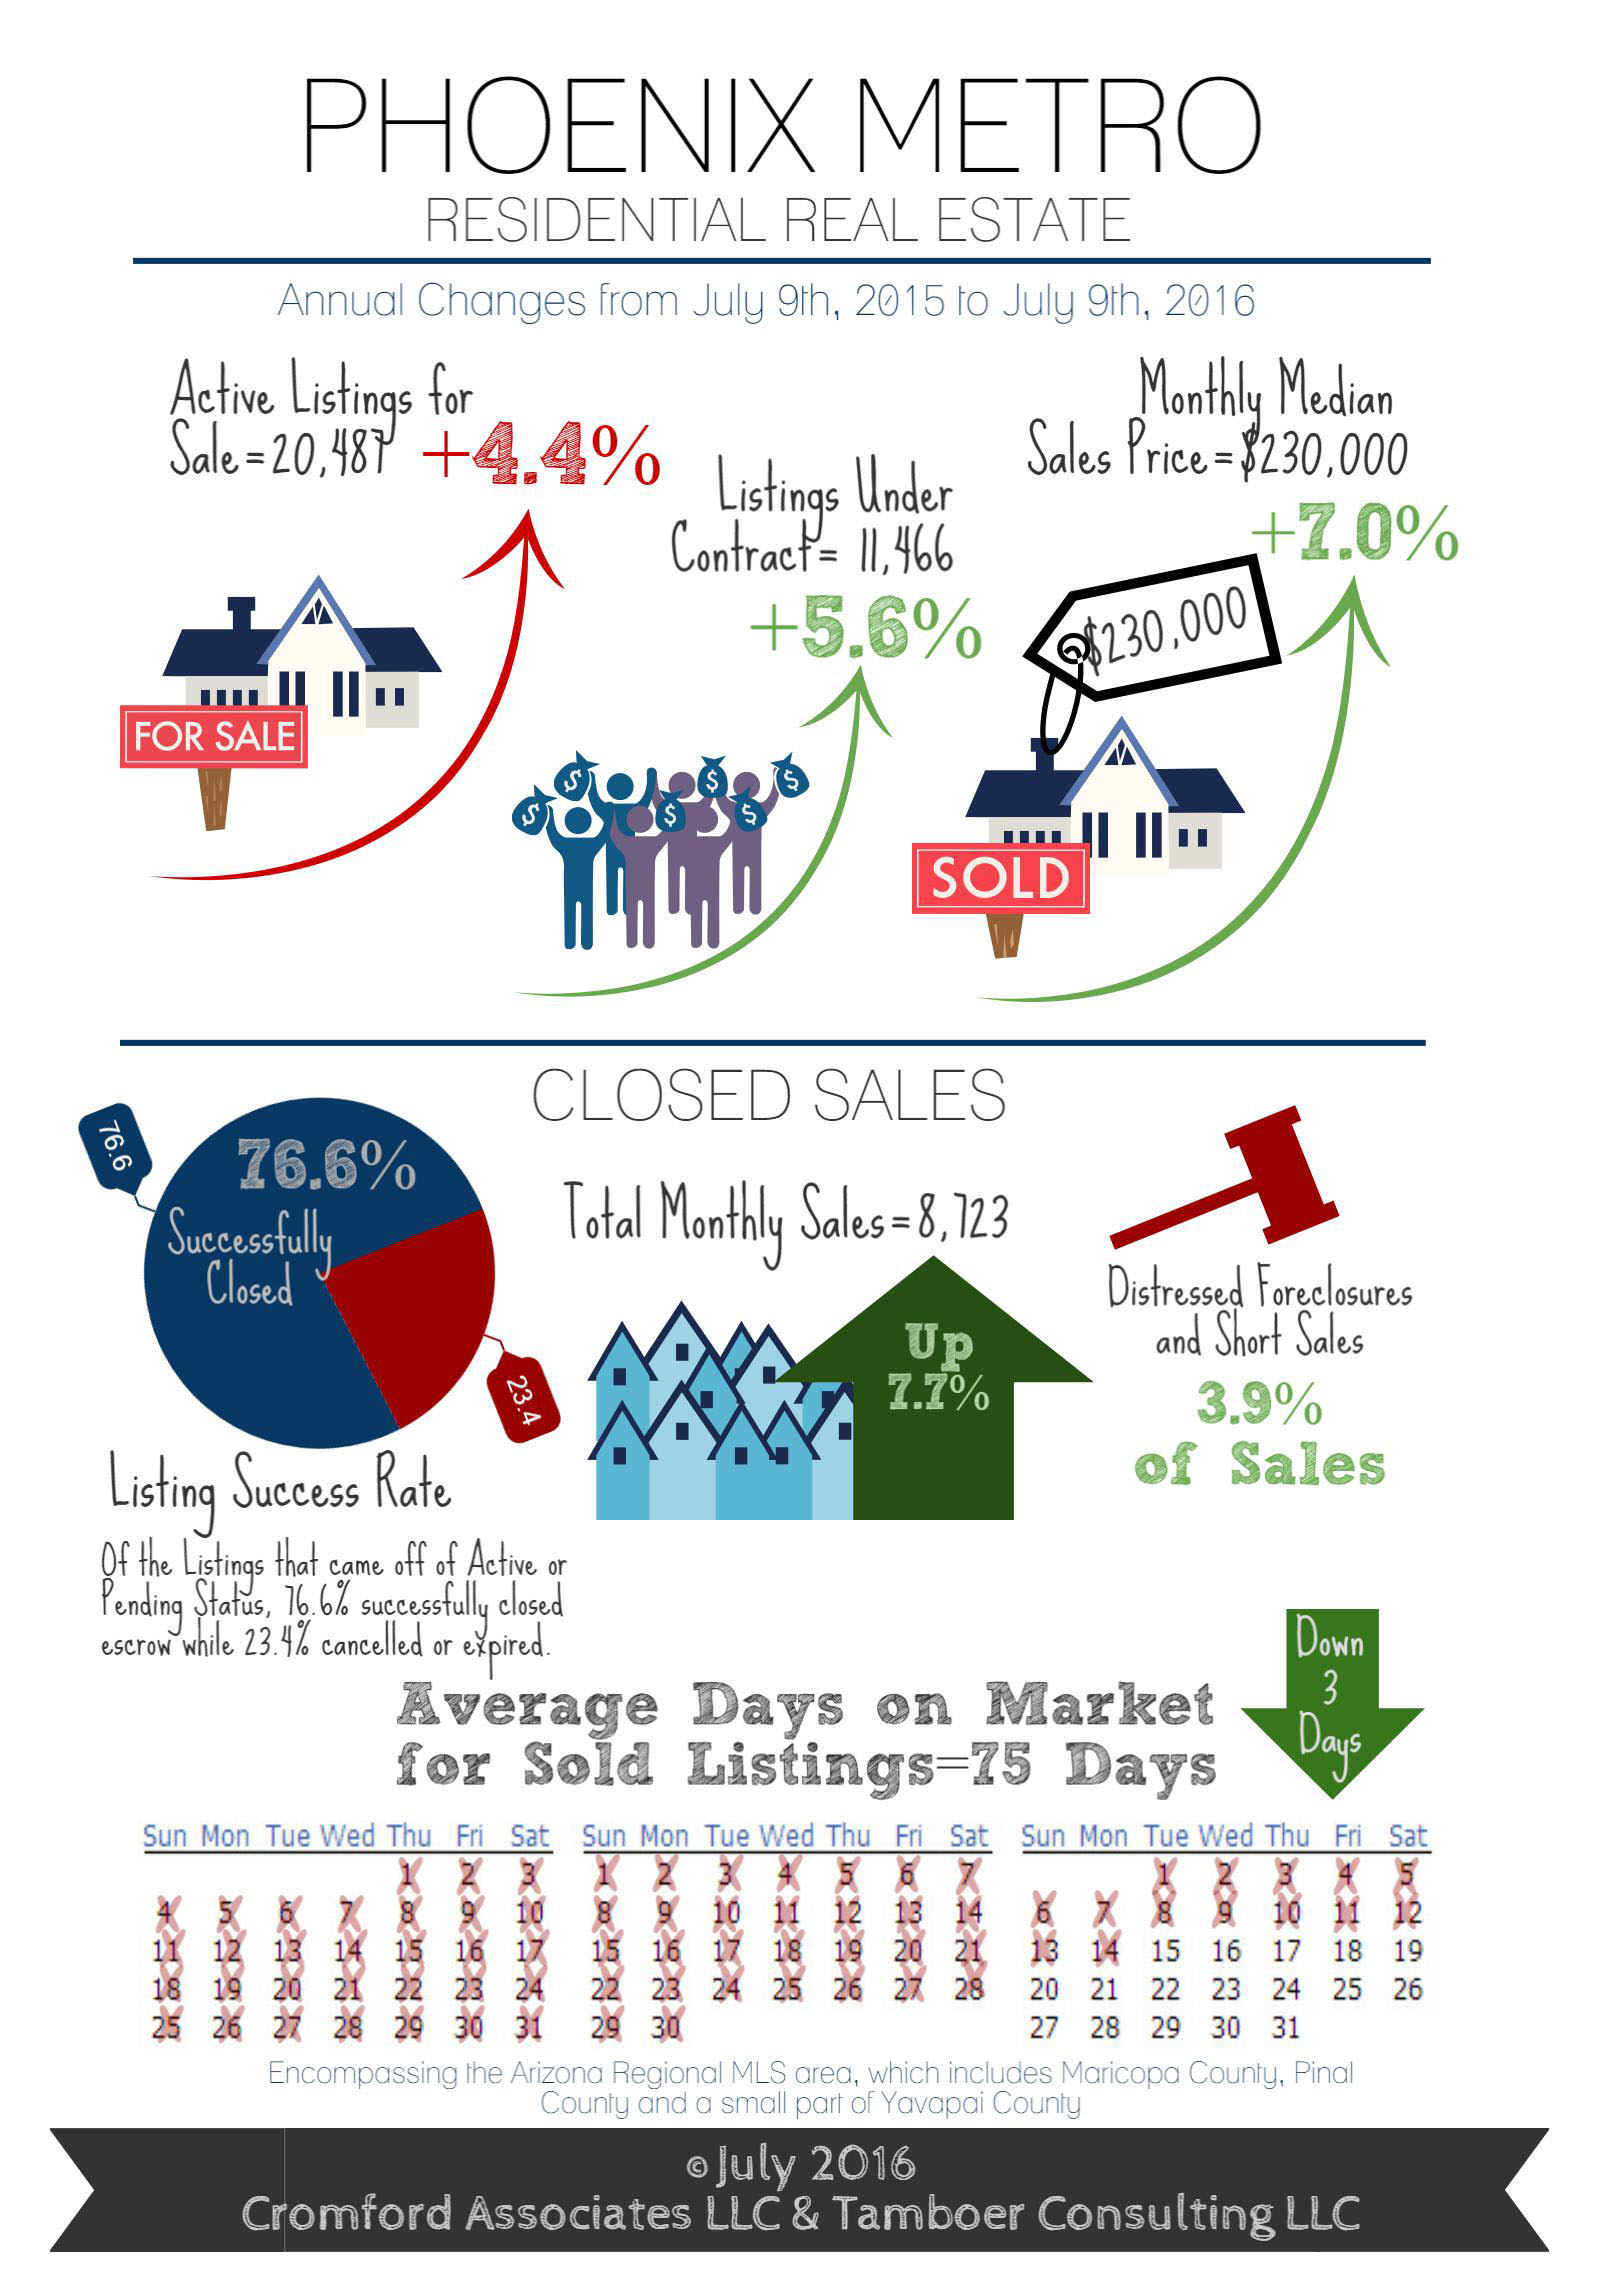
This graphic is almost a month old, but it is still holding up. Our friends at the Cromford Report are doing a good job turning dry numbers in to digestible graphics.
For Buyers:
Unless you’re looking for a property in the lowest price ranges, there’s a decent amount of supply to choose from in the Phoenix Metropolitan Area.
As prices rise, most buyers will adjust what they buy in terms of size or location in accordance with their budget. Over time, we’ve seen the average size home purchased continue to rise, even when prices were at their highest.
For example, in 2002 the average sized home purchased was 1,607sf. It rose to 1,632sf in 2006, then 1,715 in 2011 and 1,762sf so far in 2016. Of properties sold under $200K in 2006, the average size is currently 1,388sf. Between $200K-$300K, the average size is 1,829sf. $300K-$500K is 2,385sf. $500K-$1M is 3,189sf. $1M-$2M is 4,421sf and over $2M is 6,338sf.
For Sellers:
The median sales price has risen a whopping $20,000 since January’s measure of $210,000, a 9.5% increase. This type of disparity can spur articles and discussion about real estate “bubbles” and rapid price appreciation.
This looks very exciting for sellers until it’s compared to the price per square foot measure, which has only increased 1.5% from $138.73 to $140.84 during the same time frame. The difference in growth rates between the median sales price and the average sales price per square foot can be attributed to a shift in the composition of sales by price range.
Due to the lack of supply of properties below $150,000, the Phoenix Metropolitan Area has seen a significant drop in percentage of sales in this price range. Simultaneously, there has been an increase in market share within the $200,000 – $300,000 price range where there is also more supply. The increase in supply over $200,000 keeps individual property appreciation per square foot more sustainable.
However, because the under $150,000 market continues to lose market share as the over $200,000 market gains, the median sales price measure is pushed up higher than the rate of the average price per square foot. For the median measure to increase, sales over $230,000 would need to achieve 51% market share or more.


